If you’re an old-school admin who still uses “KeyServer” exclusively for concurrent-use software license management, there has never been a better time to set sail across the vast ocean of data and new features just waiting for you. There’s a reason we renamed the product “AllSight” a couple of years ago: after 30 years of development, the original “key server” use case has come to represent only a tiny fraction of what the product can do. Most of the new functionality is designed to provide admins and other stakeholders valuable insights into their entire IT estate, from the purchase order through disposal. So, hop on board and get ready for a journey across the ITAM sea. Here are the Top 10 AllSight Features (Besides License Management):
10. Remote Access
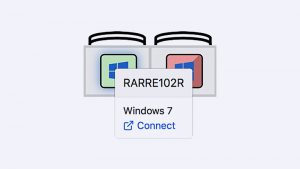
A value-added module built atop our Lab Maps functionality, Remote Access was added at the height the COVID pandemic, when campuses and offices were closing but still needed a way to provide end users access to lab software. Integrations with RDP, VNC, Guacamole, SplashTop, NoMachine, and RGS are available, and remote access can be managed on a lab-by-lab, platform-by-platform basis. Click here for more.
9. Purchase Tracking
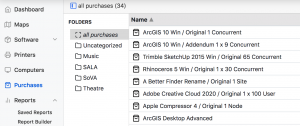
Hardware and software purchases can be easily imported from CSV files and linked directly to the associated records. Each computer, device, or software record will then contain a link back to the purchase details. Install Codes can even be linked to specific user and/or computer records, for easy re-harvesting of licenses during personnel changes. The AllSight Purchases module is designed as a major upgrade to using spreadsheets for tracking entitlements, expirations, and renewals. It can even email alerts to specific users responsible for managing individual titles or license pools.
8. Enterprise-Level Integrations
We could write a whole blog post on integration options, and indeed most of our integrations already have posts all their own. In addition, our well-documented REST API and database table structure make additional integration possibilities endless. Nevertheless, here’s a list of most of the third-party products we have created official integrations for: Active Directory, Azure AD, Intune, Jamf, TDX, ServiceNow, Jira, Modo Labs, and PaperCut. Click the embedded links for more information.
7. Loaner Checkout
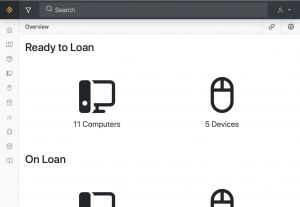
The new Loaner Checkout extra is the perfect solution to managing computer and peripheral device loans to end users. Add devices to the loan pool by lifecycle stage, and import user details from Active Directory for a quick and easy check in/check out process. Users receive a confirmation email upon check in/out automatically, and reminder emails both before and after the due date (unless they turn loaner equipment in on time).
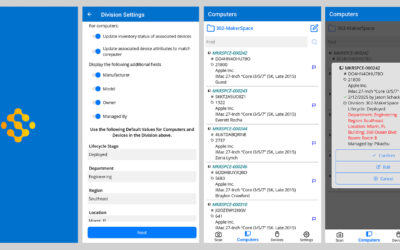
6. Hardware Asset Management
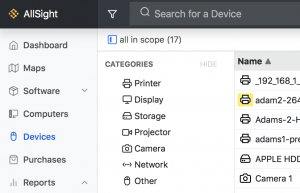
Customers have been using KeyServer/AllSight to supplement their hardware inventory management processes for a very long time. The data our client gathers about computer configuration, software installations, OS version, user logs, etc., is extremely valuable for lifecycle management and even support/ticketing. We even have scripts that automatically look up warranty dates for Dell, Lenovo, and Microsoft Surface hardware. Further, we’ve recently taken great strides toward making AllSight a complete, all-in-one, single-pane-of-glass IT Asset Management system. Computers, mobile devices, Chromebooks, monitors and disks (automatically discovered!), networking hardware, printers, and anything else you can think of, now have a place to live in the AllSight database. And just like computers, all device records have a full array of configuration and asset ownership fields to help manage who and where each device is assigned to throughout its lifecycle.
5. KPI Dashboards
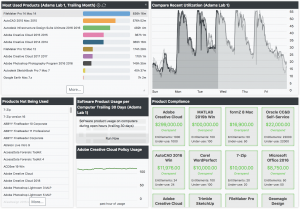
Some voyagers want to dive into the ocean and explore its depths, while others may feel more comfortable soaking up the surface-level view. Likewise, some administrators may love exploring the uncharted waters of AllSight’s 140+ report templates, widgets, extras, and other features, while others may prefer a more curated view of the data. Dashboards allow users with limited access—like C-level administrators, lab managers, or library staff, for example—to log in and see the data they need without submerging into the depths of all the data and features available. But just because Dashboards present a managed view, that doesn’t mean they aren’t interactive. Most widgets, when clicked, will take users to the background report used to populate the chart or graph. One-click reports allow users to skip the report builder, but that doesn’t mean they can’t scope each report or dashboard to particular computer groups, or quickly customize report columns, date ranges, or flip the report “view” on-the-fly. Even seasoned, long-term admins enjoy the simplicity and ease-of-access that AllSight’s KPI Dashboards provide.
4. Realtime Lab Maps

Lab Maps, Floorplans, and Software Search are three interconnected features designed to provide realtime access to information about computer labs and classrooms direct to end users. Dynamic geographic maps show users where each lab location is on campus, hours of availability, and a specific count of how many machines are available (not in use) right now. Floorplans let users see the layout of the room, which machines are free, and what software is installed on each of them. And Software Search lets users filter maps and floorplans to show them exactly which of the currently available computers have the software they’re looking for.
3. Software Audit Reports
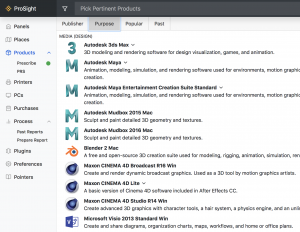
The first step to optimizing your software spend is to take inventory of exactly what you have. AllSight’s audit reports are here to help you gather the data. As long as audits are turned on, the storage drives of each client computer are automatically scanned on a regular schedule, and any changes to installed software are automatically reported to the server and made available to admins via audit reports. Audit Products (DIV x prod) or (COMP x prod) are two good reports to try. Not only do these reports normalize raw program data into software product lists, but they also tell you when each product was first discovered and last used.
2. Software Usage Reports
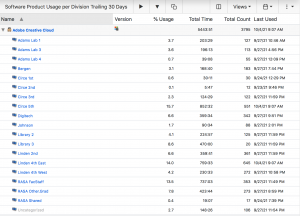
After gaining an understanding of exactly which software products are installed and where, the next step to license optimization is to get a clear understanding of software usage stats. This is where observing product families comes in. A product family is a software product definition, imported from our cloud-based Product Recognition Service (PRS), that includes all editions of a product (the Adobe Creative Cloud Family, for example, includes every version of Creative Cloud, from 2013-today). Both KeyConfigure and the web UI actually prompt you to decide whether or not to track usage for each product family discovered on the computers on your network, letting you do so with just one click. What’s great about product families is that after you make that initial decision to track them, you never have to think about them again: new editions will automatically be added to the family shortly after they are released, so you won’t have to spend a lot of time manually updating usage policies to make sure you have the data when you need it. Just set it and forget it. Software usage reports to start with might include: Usage (DIV x prod) or (COMP x prod).
1. Hardware Login Reports
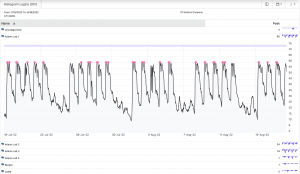
According to many of our customers, computer usage patterns, especially in labs and other collaborative learning environments, have drastically changed in the last few years. BYOD, Virtual Machines, and COVID have permanently altered the way students get work done. Computer labs used to be the only place students could go to get access to all of the software they need… but that’s no longer true. That why the Number 1 easiest and most powerful way to save money on your next hardware refresh is to analyze AllSight’s login reports to gain a better understand of exactly how your computer labs, classrooms, and other shared devices are being used. The Histogram Logins (DIV) and Logins (DIV x comp) reports are a great place to start.
That’s the top 10! What do you think—do you have a favorite feature that we missed? How many of the above features were you already aware of, and how many are brand new to you? Be sure to click on the embedded links above to find out more about the individual features, and as always, feel free to email us at support@sassafras.com you have have any questions or would like some guidance on setup and configuration.
Subscribe


Follow: