

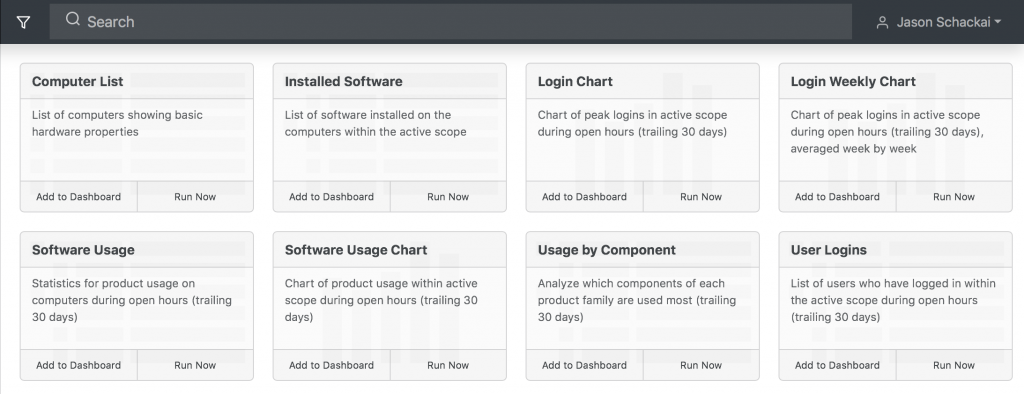
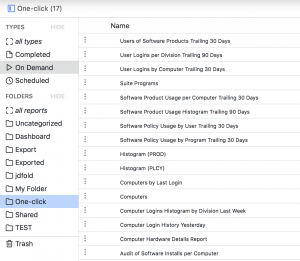
If you haven’t spent a lot of time in the Sassafras web UI, you may not have seen the Reports page, which, out of the box, contains 8 pre-configured “one-click” report templates. Even if you have spent time there building lab maps, dashboards, or using other features, you still may not have discovered how easy it is to create your own one-click report templates. In this article we’re going to walk you through the process.
The Benefits of One-Click Reporting
There are roughly 140 report options in the KeyConfigure Report Builder; and all the same options are also available in the web UI. This can be both a blessing and a curse. The blessing is that, with so many report options, you virtually always have a report available for the data you need… the curse is that you may have to sort through 140 report options to find it!
Likewise, each report has lots of customizable options like date range, target, and other ways of refining the output. You may only need to run a few reports a quarter, but without easy, preconfigured access to the reports you need, you have to rely on trial-and-error to find them.
Unless, of course, there is an easy way to turn one of the 140 report options into a customized template that’s waiting for you when you log in. This is what one-click reporting is for. After you find a report using the hunt-and-peck method described above, simply follow the instructions below to configure it as a one-click report that can then be added right to your dashboard. There are other ways of saving report templates–both for scheduled reports and for on demand reports that do no not show up on the Reports page in the web–but this blog post is focused on creating one-click report templates for easy access.
Building a One-Click Report
Report Builder
Saved one-click report templates can be found on the Reports page in the web interface, and any of them can be added to your dashboard right from there. You can edit pre-existing templates on the Saved Reports page, which is nested under Reports in the main navigation menu. To create a new one-click report, head to the Report Builder sub-page, and find the report you’re looking for in the search bar at the top.
Once you select it, you can work your way through the tabs on the left side of the page to finish the configuration.
Save As
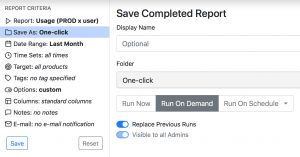 The “Save As” tab is where most of the magic happens. Each one-click report can be assigned a custom name in the Display Name field. To make sure the report template you’re creating shows up on the main Reports page as a one-click report, simply choose the one-click folder in the folder dropdown. If you don’t see this folder, your account may not have sufficient privileges to save reports there. Next, choose the Run on Demand option. Believe it or not, these are the only two steps necessary to save a report template as a one-click report. Consider turning on the Replace Previous Runs option, as this will prevent you from saving a new copy of the report each time you run it, conserving storage space on the server.
Date Range
As with most reports that allow for a date range, it’s important to select one here to make sure your report only includes fairly recent, relevant data. Standard options, such as Trailing 30 Days, Trailing 90 Days, Last Week, or Last Month are built in, or you can create a one-off custom date range to use in your report. You can even create and save a custom date range to add as a new option on this page (and in the KeyConfigure Report Builder), by opening the Time Sets window in KeyConfigure and adding a new Date Range on the left side. Most one-click reports will use one of the trailing options, as these will dynamically change based on the day you run the report, rather than run using the same static range every time.
One of the best features of reporting in the web interface is how easily you can pivot from one date range to another without changing the one-click report template. I’ll explain more in a bit.
Time Sets
Kind of like date ranges, Time Sets let you report on data within certain periods of time. However, whereas date ranges include the entire span of time between a start and end date, a time set is used to include (or exclude) only specific days and/or hours within a given date range. For example, if you only want your Login report to include computer usage during office hours (say, Weekdays from 8-5), or if you only want your software usage report to include usage during a particular class period (such as Mon, Wed, and Fri, from 10-12), you can use time sets to restrict data to only these time periods. Time sets may include office hours, class hours, open/close hours, etc., and they can be saved in the system and selectable in the Report Builder, or created as needed when you run a report.
Target and Tags
It’s not common to use Targets or Tags in one-click Reports, because, similar to a static date range, these options will be saved as a part of the template and applied each time the report is run. Rather, it’s best to use the Scope tool to the left of the Search Bar to narrow a report to a specific target Division, Section, or Tag at the time you run the report. If you are creating a one-click report for a specific software product family, such as Adobe Creative Cloud, feel free to select it as a target for your template; however, keep in mind that the target will always be applied when you click to run the report on the Reports or Dashboard page.
Options and Columns
Because all configuration settings you choose when you build your report template are saved and applied each time you run the report, it’s best to add any relevant options when you build the template. This will save you from having to add or rearrange columns, or apply options after the fact (as described in the next section) every time you run the report.
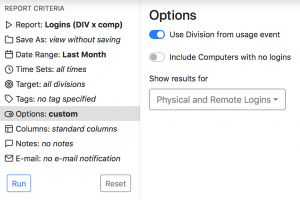 One option available in most Division-based reports (DIV) is called “Use Division from Usage Event.” This one small change can make a big difference in the report output, so it’s important to know what it does. With this option OFF, a division is treated like a “folder”: the report will run on all the computers that are currently in each division, regardless of when they were moved there, and it will not include computers that are no longer there, even if they were there during the date range of the report (think hardware refresh). With this option ON, however, instead of treating a division as a folder of computers, the report will scan the usage data for events that occurred while computers were in each division, and only include usage events that occurred in the respective division(s). So, if you moved a bunch of old hardware into a “retired” division 3 months ago but you need to run a DIV report over the last 6 months now, turn this option ON. However, if you just organized your computers into divisions yesterday, make sure this option is OFF, so you can get data on each computer group regardless of when they were placed into the division.
Notes
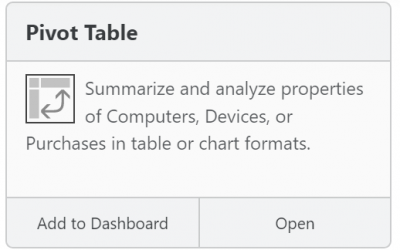
On the main Reports page, notice that each of the built-in one-click reports has a short description in the box under the display name. The Notes field in the report builder becomes the description for a one-click report. This is a great place to describe the output of the report, including the date range, or any other pre-selected options that might be useful to know before running the report.
Automatically emailing scheduled reports to users as attachments is great for scheduled reports… but we’re talking about one-click reports here, and you won’t typically want to email these out automatically each time they are run. Ignore this tab for one-click reports!
After you have finished configuring your one-click template, simply click Save, and you’ll find it on the Reports page. From there, you can add it to your Dashboard.
On-the-Fly Changes to One-Click Reports
 There are a couple of ways you can modify the output of a one-click report after the fact, without making changes to the stored template. After running a one-click report, notice the three icons in the top-right side of the screen. The first one lets you change or rearrange the columns, the second one lets you change the date range, and the third one has an option within it called “Create Similar.” Rearranging columns and/or changing the date range here will cause the report to re-run automatically based on your selection—but these changes will not affect the saved template. So, the next time you run the report, the original configuration will still apply. Likewise, if you choose Create Similar, you will be taken to the Report Builder, where all of the configuration options for the template will be pre-selected; except, rather than modifying the template, the Run Now option will be selected. So, you can add a target or tag, turn on (or off) an option, or make any other change you want to the report before running it again, without affecting the saved one-click template. If you do want to change the template, simply find it on the Saved Reports page in the one-click folder and click the pencil/edit icon.
That’s it! If you have any questions, reach out to us as support@sassfras.com.
Subscribe
Subscribe:
Follow:


 See K2 First-hand:
Follow: