
One of the reports we have recently added is the Product Optimizations report. This report aims to help you achieve cost savings by pointing out alternatives to expensive suite products. Frequently a comprehensive suite product is purchased and installed on a large number of computers when many of those computers only need a single application from within the suite, or perhaps a more limited suite product. For example, you may have deployed the full Adobe Creative Suite on a computer where the Photoshop “point product” would suffice.
The Audit data collected automatically by K2 shows which programs are installed and when a program was last used. Based on product definitions from the K2 Product Recognition Service (PRS), this program data is aggregated into suite products and point products. The Product Optimization report then shows where the various suite products are installed, and based on the “last used” data, alternative product deployments are suggested where relevant.
One advantage of this report is how little preparation it requires. In order to produce useful results, it only depends on having appropriate Product definitions and on
audit data covering a time period sufficiently long so that prior usage can reasonably be disregarded. The K2 Product Recognition Service (PRS) has definitions for thousands of products, so in most cases you could install K2, wait a couple of months, and then get good results from this report without doing any manual configuration whatsoever. Of course, you can always add your own product definitions for anything that is not already in PRS.
Here is an example of this report from a customer. Before taking the screenshot below, we changed the “view” using the drop-down menu appended to the report name (in the upper left of the window). The various views switch the grouping order, but they are all based on the same underlying data. Also, “Customize Columns…” (right-click in the column header bar) has been used to make sure that the Count Details column is visible. This column shows how many detail records lie within each summary.
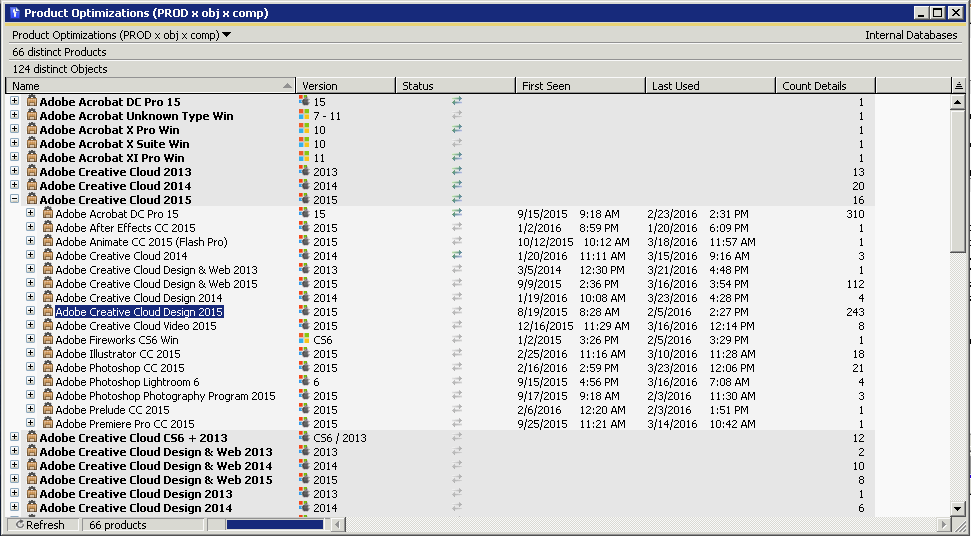
We’re looking specifically at Adobe Creative Cloud 2015 to see where we might save money by installing alternative products. The top level, in bold, shows products that are actually installed on computers. The second level, exposed in the screen shot under Adobe Creative Cloud 2015, shows possible alternative products. The right-hand column, “Count Details” shows how many detail records appear within each group. For the alternative product suggestions, this indicates the number of computers which appear to only require that suggested product – we could see the list of the specific computers by clicking the plus sign.
There are 16 detail records (i.e. products) listed below the complete Adobe Creative Cloud 2015 suite. The one highlighted in blue, Adobe Creative Cloud Design 2015, is a more limited suite showing “Count Details” of 243. Apparently these 243 computers could be satisfied by an installation of Creative Cloud Design instead of the complete Creative Cloud suite. Although they have the complete Creative Cloud installed, only components included in the less expensive Creative Cloud Design product have been used since audits have been collected. Perhaps a more significant potential savings is suggested by noticing the 310 computers that have only used components included in Adobe Acrobat DC Pro 15. The sum of all the counts for all 16 of the suggested sub-products is 732. Many of these computers may be candidates for reconfiguration with a cheaper product.
The Product Optimizations report does not directly show us how many computers have the Adobe Creative Cloud 2015 suite installed, but that information is only few clicks away – with Adobe Creative Cloud 2015 selected, right click to run the Audit Products report. In our example, it shows installation on 1363 computers, so the 310 computers using only Acrobat that we noticed above comprise roughly 25% of the installs! By focusing on just this one sub-product there is a huge potential to achieve costs savings when software subscriptions are renewed.
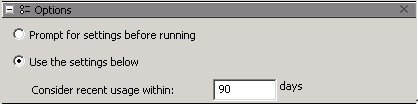
Note that the Product Optimizations report has a configurable threshold for what is considered “recent usage” – this appears in the Options pane of the Report Builder. In our example, a threshold of 90 days was used.
Whenever there is a choice between suites and point products, or between big suites versus small suites, this report provides a way to quickly gain insight into potential cost saving optimizations. For a more detailed look at actual usage patterns, not just “last used”, you must set up a Policy in K2 so that usage events for a product and its associated programs will be logged. Then many K2 usage reports can be used to give further insight on usage patterns for specific computers and specific products.

Subscribe
Subscribe:
Follow:


 See K2 First-hand:
Follow: