
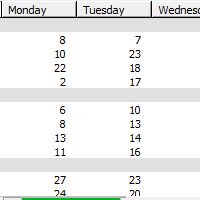
In the 2015-02-25 image, we have added six new Login reports. Here’s a quick peek at one of them:
The report above lets you easily compare computer utilization on different days. This report has been customized to show days, with no further detail – but it can be configured to be more granular, displaying distinct hours, or even quarter hours. This type of analysis can be especially useful when making decisions on how many computers to deploy in various labs and how to efficiently schedule lab availability hours. There are many login reports that already provide insight into such questions so let’s begin by reviewing this framework before discussing the new options (or you can jump right to the New Reports).
Logins (DIV x comp) etc
There are five reports in KeyConfigure’s “Login” submenu that simply display login counts and times for each computer within the various divisions – but each one groups this same data in a different way. Logins (DIV x comp) is probably the most frequently used.
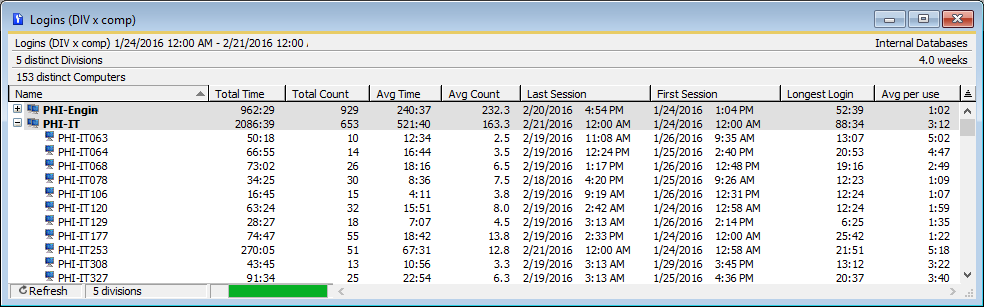
Each row of the report can show
– Total Time – total duration of logins, displayed as hours:minutes
– Total Count – number of logins
– Avg Time – average duration of logins per week, displayed as hours:minutes
– Avg Count – average number of logins per week
– Last Session – time of last logout. Note that currently active sessions are not included in the report
– First Session – time of the earliest login. Note that currently active sessions are not included in the report
– Longest Login – duration of the longest login, displayed as hours:minutes
– Avg per use – average duration of each login (Total Time / Total Count)
Some of these columns shown above are hidden by default, but before running the report, we selected them in the Columns pane of the Report Builder for inclusion, as shown below.
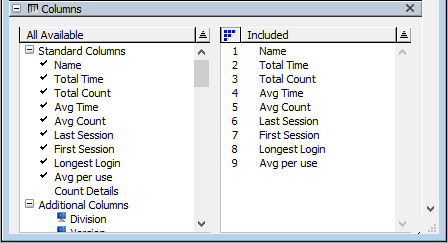
When running the report from KeyConfigure, you can display or hide columns after running the report – just right click in the header and use “Customize Columns”.
Logins OS Percent (DIV x comp)
The various OS Percent reports are “specialty” reports in a sense – they provide very specific data and so might not be useful except in certain cases. Primarily they are designed to look at dual-boot computers and analyze relative usage of different OS’s.
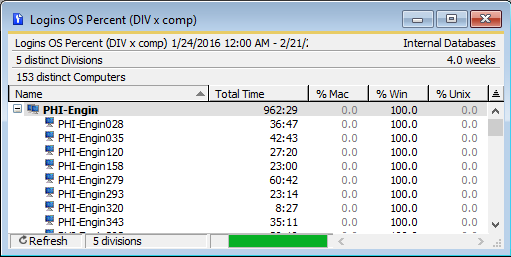
Even when every computer shows 100% Mac or 100% Windows, you could use this report to get a sense in a lab with both OS’s, which OS was more popular. Of course this would be modulated by the number of computers of each OS available to begin with, as well as the number available once the lab starts to reach capacity.
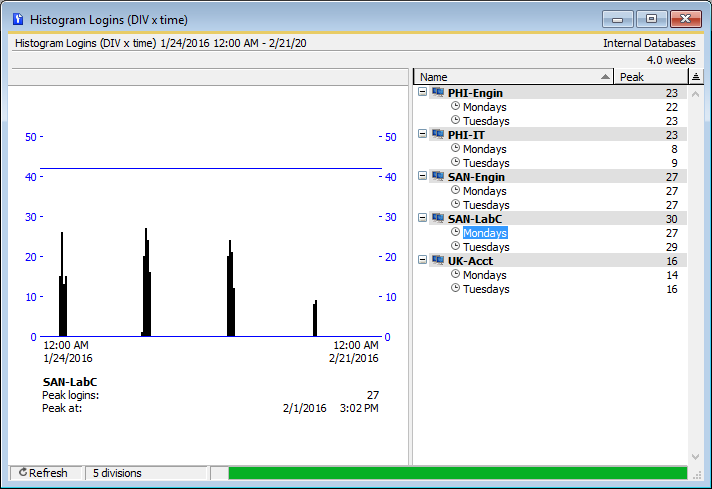
Histogram Logins (DIV)
This report is primarily focused on calculating the number of concurrent logins over a specified time range, and the peak (or maximum) concurrent logins for each division.
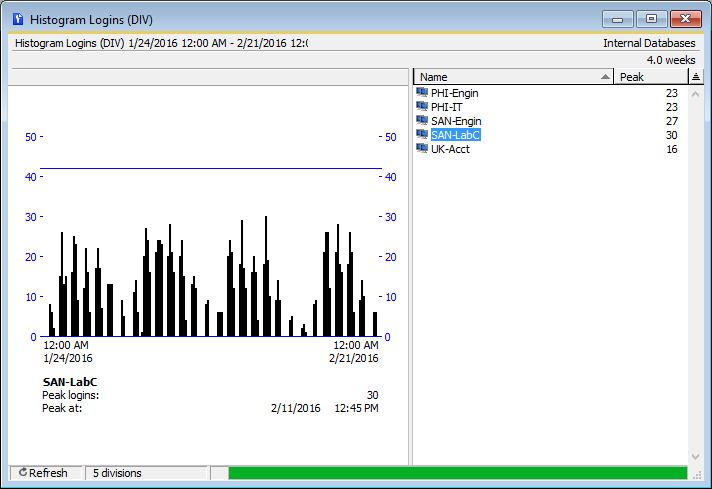
The specified time range is partitioned into 168 equal intervals and the concurrent peak within each interval is graphed in the histogram. If you run the report on exactly one week, each interval will be an hour. The report lets you see not only the peak over the entire time range you specified, but you can also visually see the pattern of logins. Note that Summarize Logins (DIV) is identical to this report but does not have the graphical histogram – only the columns such as Peak and Count.
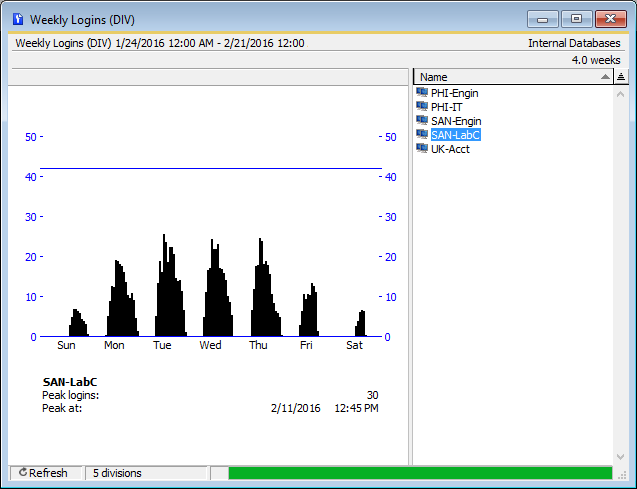
Daily Logins (DIV) and Weekly Logins (DIV)
These two reports do calculations similar to the Histogram Logins (DIV), but regardless of the time period selected, display as an average week or an average day. The Weekly Logins (DIV) run on a multi-week period will display a value for each hour of the seven days – but this value is an average of the peaks seen in this hour throughout the multi-week period. For example, in a two week period, suppose on the first Monday between 8AM and 9AM peak usage was 12 and on the second Monday between 8AM and 9AM it was 16. The Weekly Logins report for the two week period will show 14 for this hour (the average of the two values, 12 and 16). Likewise, the Daily report will average every Day in the selected Time Range and shows average peaks for each time of day.
Time Sets
Suppose you wanted to run a Histogram for an entire month, but instead of knowing the peak concurrent logins across the entire month, you instead wanted to know the peak concurrent logins at any point in time just on Mondays, and compare it to Tuesdays. To do this you would define two “Time Sets” for Mondays and Tuesdays. In the Time Sets window, right click and select “New Time Set”. Then in the Time Set details window, right click in the Time Periods list area and select “New Time Period” – then check Monday.
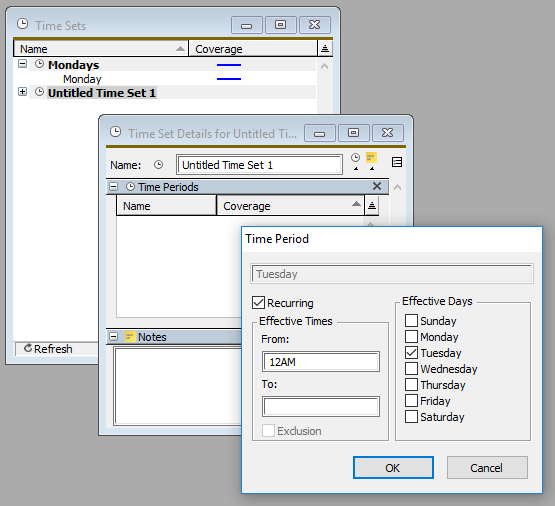
Choose a name for the new Time Set and close it. Do the same for Tuesday. Then in the Report Builder window, apply these Time Sets.
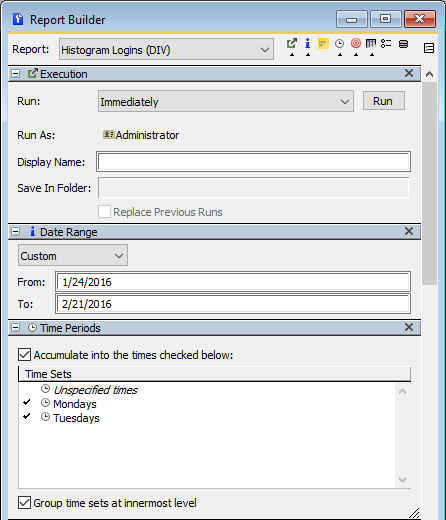
When you run the report, you’ll see the Divisions as usual, but each one will have detail lines for each Time Set. The “Peak” value listed on the Time Set lines is the Peak just within that Time Set.
Time sets can be applied as a further refinement to most of the time based reports.
As you can see from the discussion above, we already had a lot of very flexible reports for analyzing logins. But in 7.3.0.9 we have added new reports to help you see data points within specific time intervals, similar to the use of Time Sets above. Time Sets are very powerful for “irregular” times, like comparing 8-11AM Tuesday and Thursday to 9AM-10:30AM Monday Wednesday and Friday. But if you simply want a number for every day within your specified time range, or every hour, this is harder to do with Time Sets. The new reports do exactly this – break your time range into distinct days, hours, or 15 minute intervals.
Login Peaks (DIV)
Let’s look first Login Peaks (DIV). Notice, first of all, that the report builder window has an “options” pane for this report. The options pane is where you can choose between day, hour, or 15 minute granularity. When choosing hour or 15 minute granularity you can also limit the report output to only display certain hours – leaving out uninteresting times of day where logins are going to be low or zero. Here we’ve run the report on hours between 7 and 18 (6 PM), on one week:
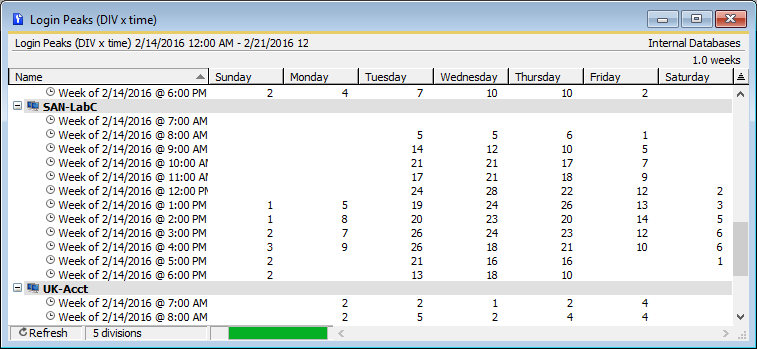
This is exactly the same data that is in the Histogram Logins (DIV) report, just presented differently – numerically instead of graphically, and with days of the week split into columns, which makes it easy to compare peaks on different days but at the same time.
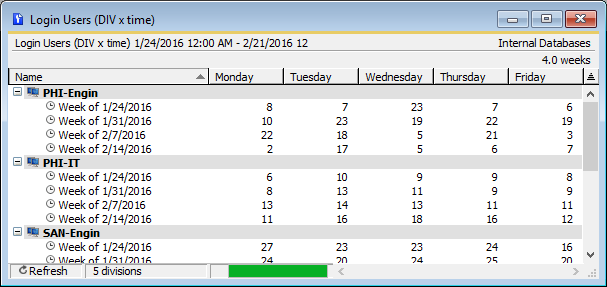
Login Users (DIV)
The options and layout of this report are identical to Login Peaks (DIV). The difference is that this report shows the number of Unique Users who logged in during each time interval, instead of the peak concurrent logins. Here’s an example where we’ve run over 4 weeks with a granularity of a day. We have also hidden the Saturday and Sunday columns
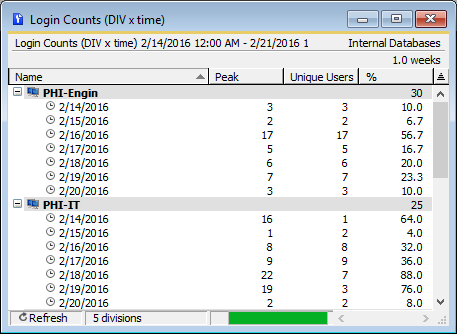
Login Counts (DIV)
This report includes Peak logins as well as unique Users. It also shows the total number of computers in each division, and the percent of Peak / Count (i.e. what percent of computers in the division had someone logged in at peak). In this report, every time interval is displayed as a row – there is no wrapping of days of weeks into columns. As a result, this report might be harder to read on screen, but it is likely easier to save as text or xml, and do further manipulation in another program like Excel.
Login Average reports
Finally, there are three more new reports: Login Average Counts (DIV), Login Average Peaks (DIV), and Login Average Users (DIV). These are identical to the Peaks, Users, and Counts reports described above, except that they average multiple weeks together.

Subscribe
Subscribe:
Follow:


 See K2 First-hand:
Follow: