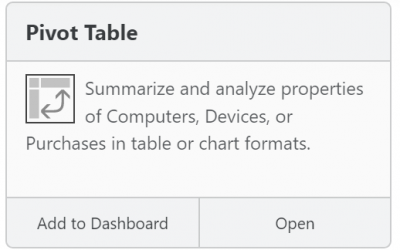


The question has been raised many times, “Can I make my own dashboard widget showing report data”. Depending how the question was perceived, the answer may have been no. You can’t after all make your own bar chart or pie chart based on the data. However, you CAN show arbitrary HTML in a widget, which can include frame embedded completed reports. This allows both list type report results, and Histograms. This post will walk through the steps needed to put all this together.
Making the Report
In the Web UI, go to the Reports -> Report Builder to make a report you want to put in a Widget. If you already have one made, some edits may be needed using the below criteria. The basic idea is to set up a scheduled report that can then have the completed report shown in the widget.
- You may need to create a report Folder that is publicly accessible. Remember that Uncategorized is actually a special folder where admins only see their own reports (root admin can see all). So, if you don’t already have a shared folder, click the + to make one in Saved Reports.
- In the Report Builder, choose the Report you want and set your options and parameters as desired. Make sure to set these items:
- Save As – Set a recognizable name to work with the template later, it will save confusion.
- Save As – Set the Folder to one you made that is public (i.e. not Uncategorized or One-click).
- Set the report to run on Schedule. Pick a schedule that makes sense for the intent of the report. For example, weekly for a trailing 30 day Histogram.
- Set the option to Replace Previous Runs. This is highly important as this process will not work if this is off.
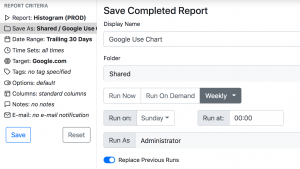
- Save the Report
- Go to Saved Reports and select the Folder you saved it in to find the template you just made.
- Click the pull down (far left 3 dot icon) for the report and Run Now. You’ll be taken to the report results. Verify this is what you expect and go back and edit the template if needed to make changes. Note that changing some parameters will cause a new template to be saved instead of replacing the old one. In this case delete the old one, and Run Now on the new one.

- Return to the Save Reports and find the Completed version of the report. It will have the document icon. Click on the Arrow icon to View the result. This may seem like a loop, but the URL when you View the Completed report is very distinct from the URL when you are looking at the results of Run Now from a Template.

- Copy the URL. It should be something like https://my.keyserver.address/archive/Shared/57df1bd4-31c96de2.ksr
This process gives us a report that will run on a schedule and replace the resulting completed file. We can now embed that completed report view into a Widget.
Making the Widget
Now that we have made the template and it’s generating a completed report, the real trick is just putting it in a Widget. You could just email that URL to people and they could use it to view the report results whenever the like. But adding it to your Dashboard with other Widgets really makes this robust.
- On your Dashboard, click the + in the upper right to add a new Widget.
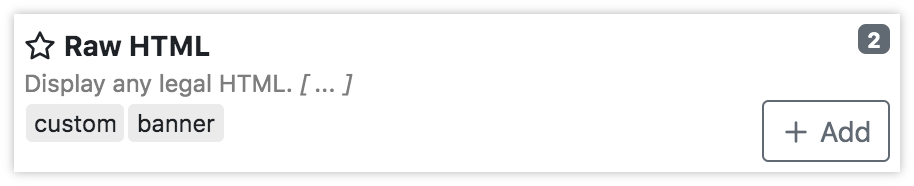
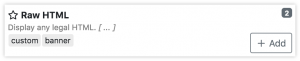
- Click on Custom in the Tags section. You should see Raw HTML at the bottom of the resulting widgets. Add that to your Dashboard. Note this can be a useful widget if you’re not familiar with it. Any html can be put in such a widget as if you were making your own web page. This can be nice for static information, or using the following technique to embed information from other websites. See more thoughts on this below.
- Click the Gear icon on the Widget to customize it. Give it a nice display name.
- In the Content box, put in this code:
<iframe
 src='https://my.keyserver.address/frame-core/archive/Shared/57df1bd4-31c96de2.ksr'
 seamless='seamless'
 height='340px'
 width='100%'
 frameborder='0'
 >
 </iframe>
The important part of that code is the address. Note it is the URL we captured above, but with one important difference. We put frame-core in the address right behind the main server address. This is a technique used across our Web content for Embedding in other sites. In this case, we’re embedding our own content to pull off this trick.
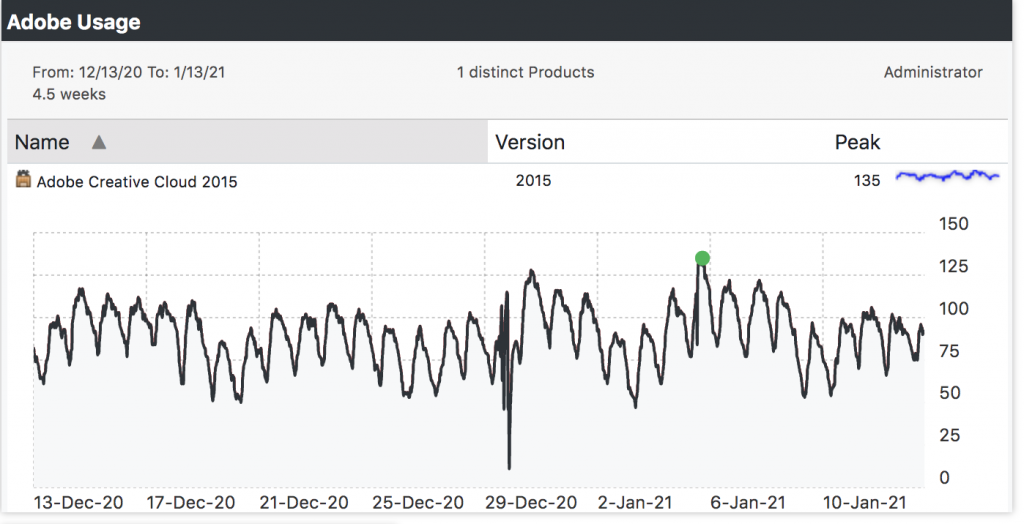
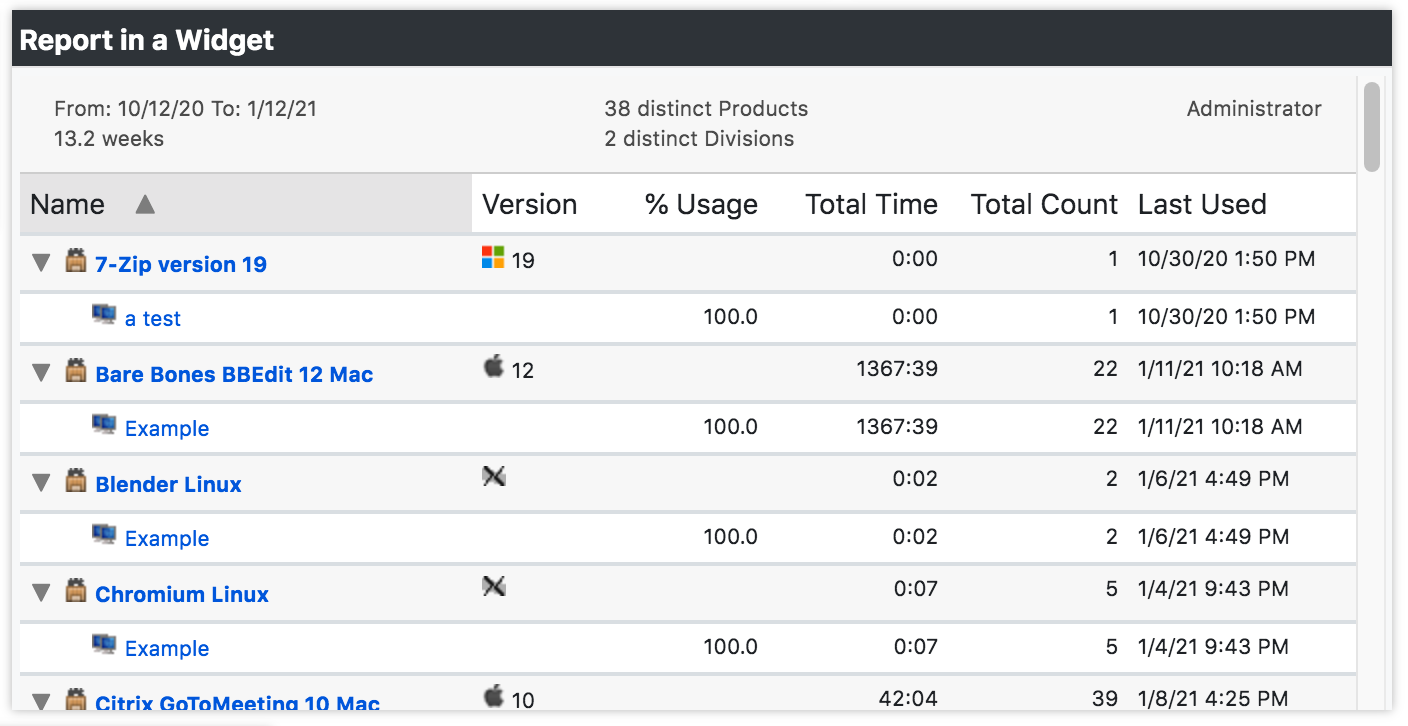
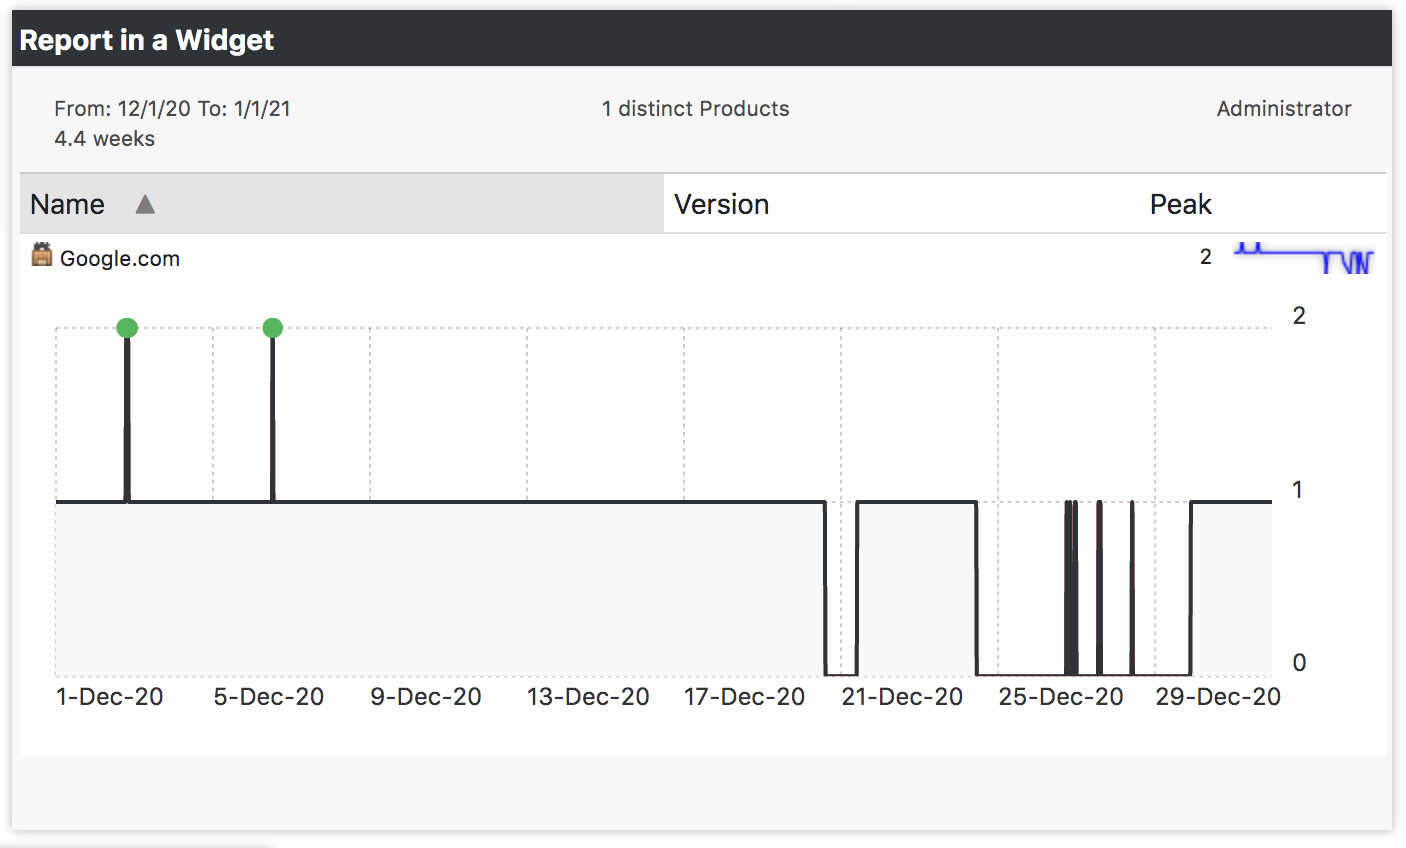 Once you click Apply, you should now see that report result in the Widget. Adjust the size of the widget as needed to well fit the content. Note the height parameter in the above code block. The value of 340px is good for Histogram reports to ensure the X axis is shown and the chart fits well in one of the snap sizes for widgets. You can play with that height setting as desired to make other reports fit in widgets of different heights.
Additional Thoughts
The Raw HTML Widget
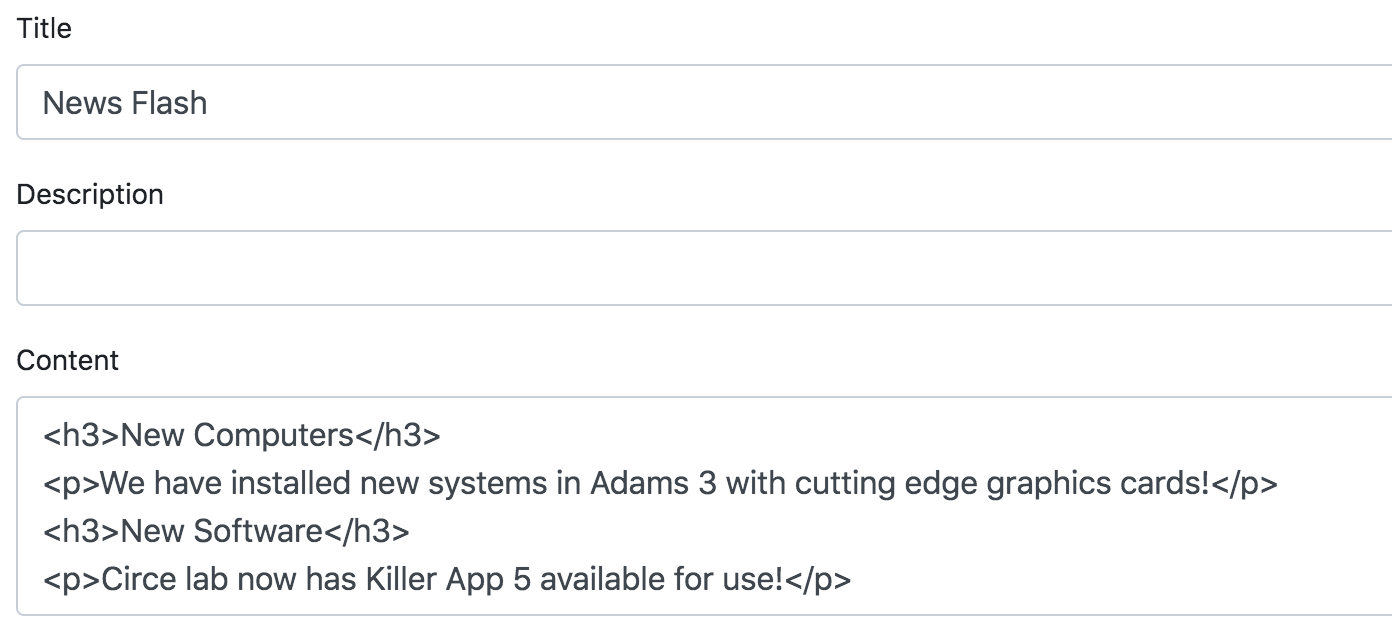
As mentioned the Raw HTML widget is very flexible. You can use this for a wide variety of uses on a Guest or authenticated user Dashboard. For students, it might be a news box, or embedded information from another IT website. For an admin, it might be the display of information from other service platforms. In other words, you could use the Sassafras Web UI as a single pane of glass dashboard for data from multiple web based systems. In addition to our rich data and built in widgets, view your antivirus dashboard, network status, or whatever you may have in your environment.
Be careful of getting too fancy as you can cause corrupt code to make the page not load at all, not just the widget. Basic HTML should be fine, but once you start adding CSS you might interfere with elements we are already using on the parent page.
Folder Permissions
Note when we talked above about the Folder you need to create to save the Reports in to, we made some assumptions. By default using our built in Roles and Accounts, a new folder and all reports it contains are viewable to all users. If you have custom Roles on your server, you may need to use the Reports window in KeyConfigure to modify the ACLs of a given folder to make it viewable to those custom roles. This is more advanced and not covered in full here, but worth mention to avoid confusion for those using those capabilities.
Until Next Time
We hope this is a useful trick for customizing your dashboards and adding even more value to them. Feel free to contact us with questions or comments. Stay safe out there.

Subscribe
Subscribe:
Follow:


 See K2 First-hand:
Follow: