Most organizations still manage their desktop IT assets the old-school way: an Excel spreadsheet. While that’s a step up from pen and paper, it’s also hard to maintain and prone to errors, while completely disregarding the most valuable, actionable data: usage. It’s great to know where things are, but when the time comes to renew software licenses or replace hardware, what you really need is data about usage. By layering accurate, detailed usage information on top of inventory, you can make better IT decisions, which almost always translates into less IT spend.
When you decide to upgrade from the spreadsheet approach to ITAM, there are three tiers of data you can leverage:
Tier 1 – Make sense of data from another system, like SCCM
Tier 2 – Periodic Updates
Tier 3 – Active Usage Tracking
Tier 1 — SCCM
MECM, Microsoft Endpoint Configuration Manager, formerly SCCM (System Center Configuration Manager and Systems Management Server), is a systems management software product developed by Microsoft. The first thing most admins do when they realize budget constraints force them to optimize their next IT purchase is to lean on SCCM for inventory and usage data. The second thing they do is realize the data is inaccurate and not very helpful. It’s better than nothing (sometimes?), but SCCM and similar tools weren’t designed for this purpose, and relying on the data they provide is often just as risky as guessing.
Tier 2 — Periodic Updates
Some tools are designed to provide better usage stats, but they do so intermittently and not in real time. While a huge step up from unreliable stats, incomplete data is still inaccurate data, and you’ll still be left guessing about the gaps in usage information. Also, track now and report later tools inherently offer fewer additional features, like realtime license management and availability information for end users.
Tier 3 — Active Usage Tracking
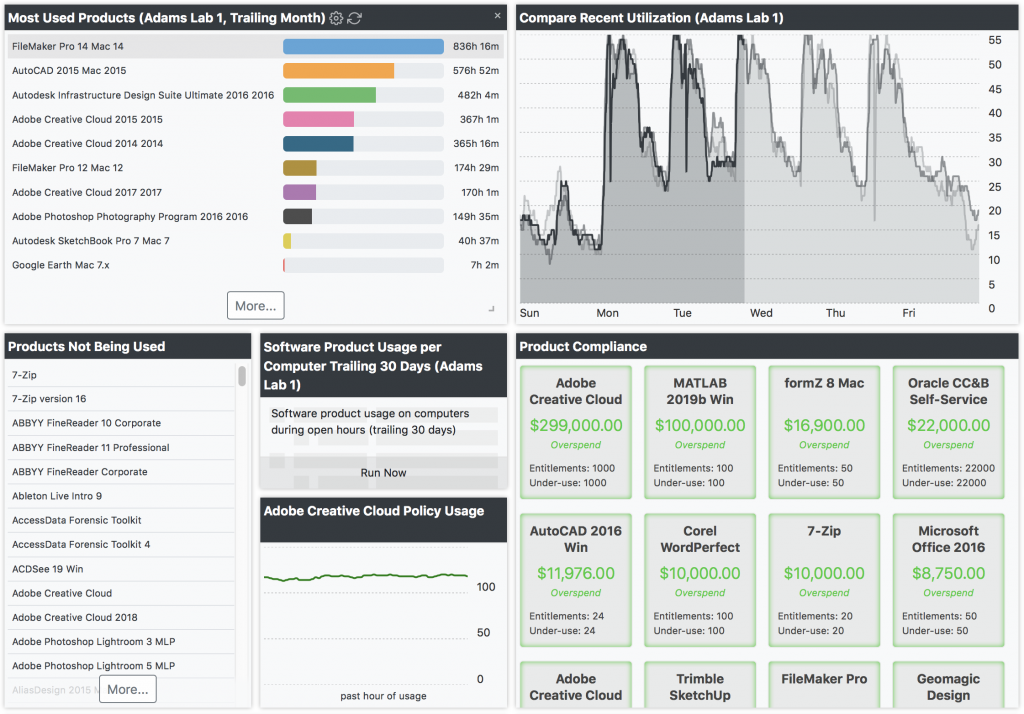
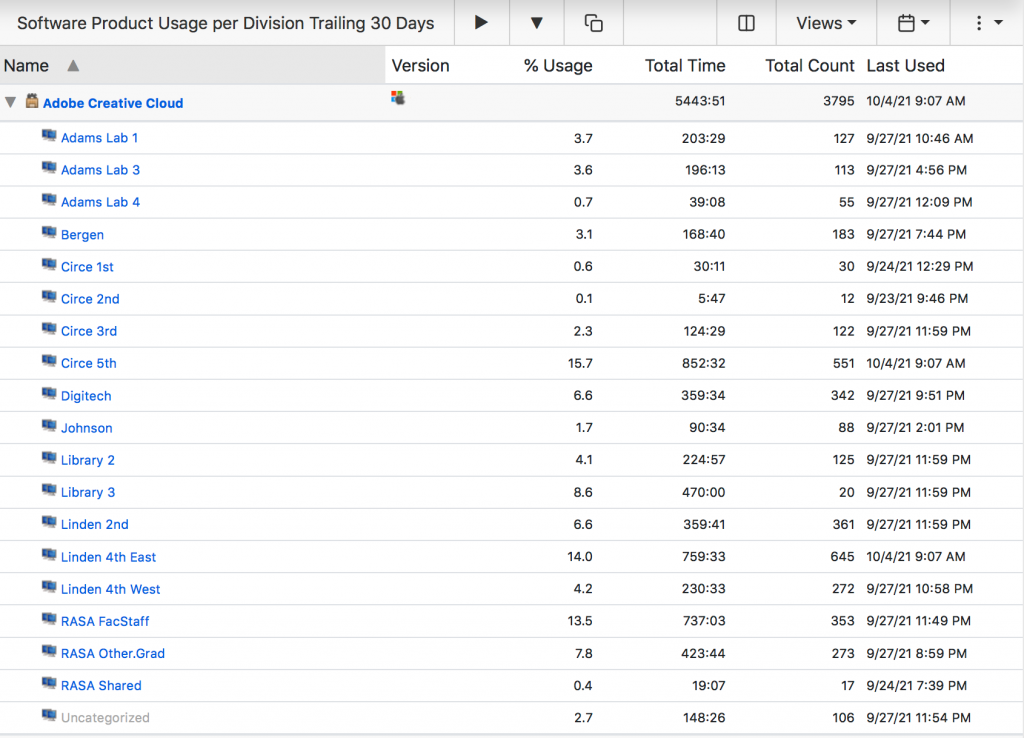
A hallmark of a mature ITAM program is the ability to collect active, realtime usage data and retrieve it on demand, exactly when and where it’s needed. Not only can hardware details and software inventory be gathered and updated daily, but live availability maps can also help “flatten the curve” of peak usage, empowering end users with an interactive software directory and live status information for each lab and classroom.
The transition from a periodically updating tool to one like Sassafras LabSight or AllSight—featuring realtime tracking by our lightweight, scalable, next-to-no-bandwidth client—represents a paradigm shift in the way you manage your IT Assets. Without usage, you are flying blind. Periodic updates help you see; but realtime tracking and daily inventory updates give you x-ray vision, allowing you to optimize your hardware and software spend each year with precise information about exactly, when where, and how each computer and software title is used.
Why rely on end users or faculty to tell you how much a given asset is used or how badly it’s needed? With realtime tracking, you can build a dashboard that displays all the stats you need, helping you find:
- unused or underused software titles
- unnecessary computers, like personal laptops that are rarely used, or labs that never fill to capacity
- security risks, like old OS or software products
- lost/stolen computers (history of IP addresses)
- oversights in software distribution, for those times when SCCM fails in its primary function
The more you know, the better you’ll be at right-sizing your IT purchases and efficiently distributing resources to meet demand. And the more informed your end users are about resource availability, the better they’ll be at managing their own needs. If they can see the days and times a lab tends to be busiest, they are more likely to choose less active times to visit, which in turn helps you distribute limited resources more evenly.
At Sassafras, our job is to help our customers see not just what they own and where it is, but also to help them get a clear understanding of exactly how, when, where, and by whom all their IT assets are being used. Our products are simple to set up, easy to use, lightweight, scalable, and the data they provide is extremely accurate. To learn more, request a live demo at https://www.sassafras.com/see-live-demo/
Subscribe


Follow: