Sassafras Server Web UI
The Sassafras Server runs a web service (called KeyReporter at the system level) that provides a browser based Web UI. This interface provides the majority of daily functionality for most users. Full Administrators will still find cause some times to use the KeyConfigure desktop application to work with the server and the backend data.
Note not all features are available in the LabSight or KeySight product tiers, only AllSight includes all platform features.
Main Navigation
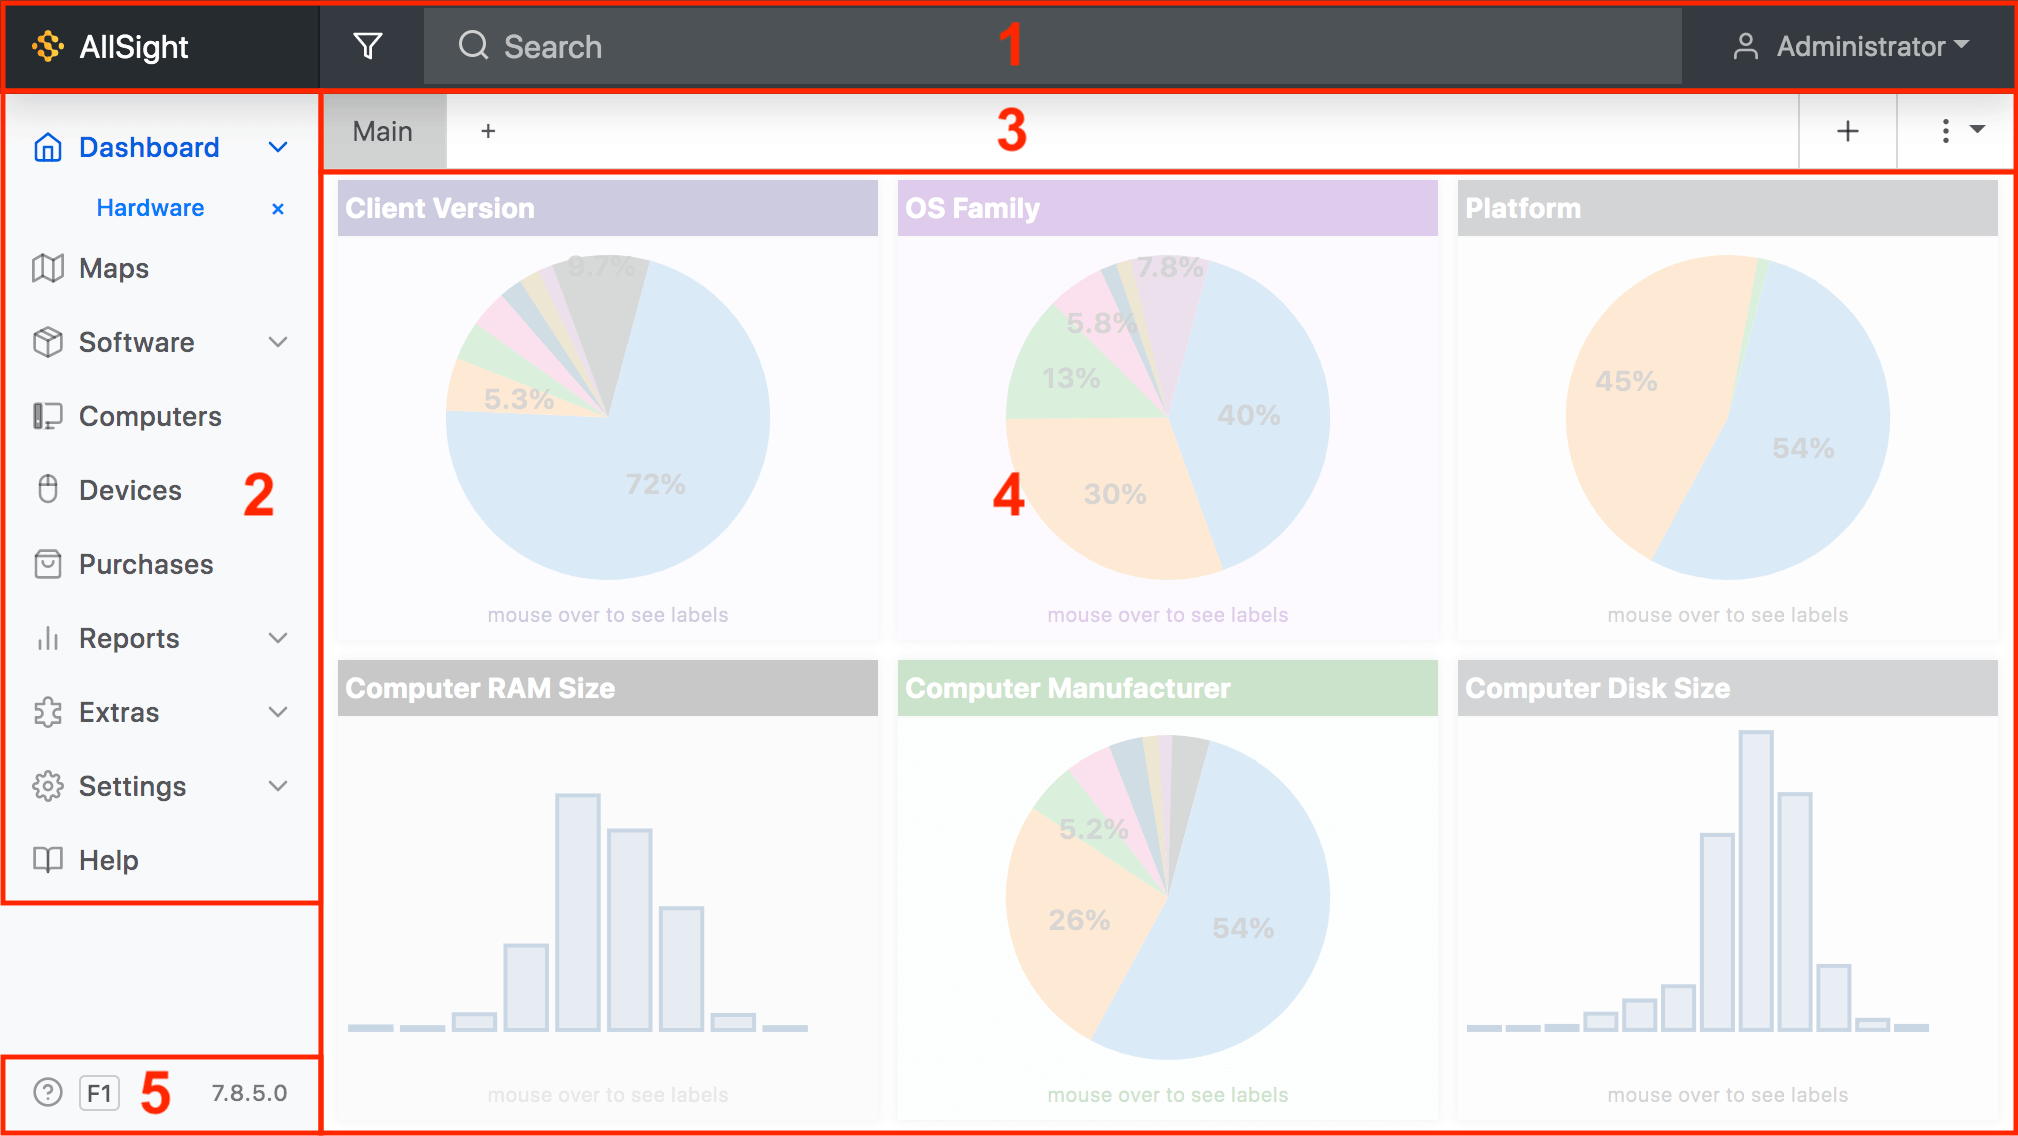
There are four main areas of the Web interface.
- Header Bar - The dark gray (by default) area extending across the top of the screen. From left to right this contains:
- Name of your instance. This can be changed in Settings - General.
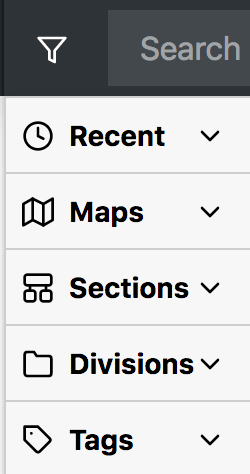
- Scope - The funnel icon. This allows you to pick a scope for the current page, so for example the current active dashboard widgets or computer page only show data for computers in a certain Division. It will also be dynamically applied to any Report you run. Be aware of a "sticky" scope from one page to another possibly giving undesired results when you intend to shift focus.
- Search bar - find things related to the current page, like a Computer by any displayed property, result lines in a Report, etc. On the Dashboard this is global, and the icon next to each result indicates the object type.
- Favorites - The star ☆ icon (available on list pages like Computers and Purchases) is a drop down showing recent and favorite items. This has drag and drop interaction to add items and pull items into fields as needed.
- The Account drop down allows viewing account options, viewing assigned Assets, logging out, and changing light/dark mode.
- Side Navigation - The list of features on the left pane where you navigate between Dashboards, Maps, Reports, and the other lists and functions. Some items will have a disclosure triangle to expand them, like Dashboards and Reports.
- Ribbon - Just below the Navigation Bar is the tools Ribbon for the current core feature you're working with. It will have tools and options appropriate to that feature such as adding tabs and widgets in the Dashboard, adding a new Map tab, or changing your Software sort order. The ⁞ ▾ drop down will have more items like quick access to Reports and Scripts, saving output, Form views, and more.
- Core - The main part of the screen that contains the core feature you're currently working with, such as the Dashboard Widgets, Maps list, Computer list, Report builder, etc. This may have a sub navigation pane in many pages. It is worth noting this core can easily be embedded in external websites, allowing external views on organization sites of things like Widgets, Maps, and the Software list.
- Info - Quick tour help button and current version indicator. Click the tour for a quick overview of the features on the current navigation item you have selected.
See our Walkthrough of the Web UI for a more detailed introduction to the various concepts and iconography.
Features
Note that these various navigation items are dependent upon Roles and Priviledges. Guest (if enabled) will see only public Maps, Software, and any Dashboard that has been configured by an administrator. The built in Report Only role for example will have Printers and Computers hidden in the navigation. You can customize what is available to users of the Web UI via Roles and Groups along with ACLs.
- Dashboard
- Maps - LabSight and AllSight only
- Software
- Computers and Devices - (Devices not included with KeySight)
- Purchases - AllSight only
- Reports - Limited in KeySight
- Extras
- Settings
Lists
Certain data tables in the platfrom do not yet have dedicated management pages in the Web UI. You can manage these fully in KeyConfigure in the mean time. However, these tables can be seen in a raw list view in the web, and the objects are hyperlinked to their details. To view these, follow the URL syntax of allsight.server.domain/list/table where table is one of:
These lists are searchable using the top navigation Search.
Product is also a viable option, but the Software -> Manage page is a more useful look in most cases. Other options like Computer, Device, and Purchase will simply take you to the relevant management pages documented at the above links.
Dashboard
The Web UI has a dashboard view that can be configured independently for each Administrator (any authenticated user of the system), so each person can have a unique view suited to their role in the software. Any administrator with the proper permissions can also save dashboards for other users, including the default for all new users without a personal dashboard, and the public Guest or Community view. When logging in to the Web UI, your default view will be of your dashboard, or the Default dashboard if you have not yet made a custom dashboard. If the Guest dashboard is blank, the default view is Maps. The dashboard can be customized to include whatever widgets you want using the + in the upper right and dragging them around and resizing as desired. Widgets provide quick summaries of richer Sassafras Server configuration and data. For documentation and screenshots of all of the available widgets, see the Widgets list.
In any new Dashboard there is a single tab named "Main" - additional tabs can be added by clicking the smaller plus just to the right of the existing tabs. Tabs can be renamed by double clicking on them, but not the Main tab.
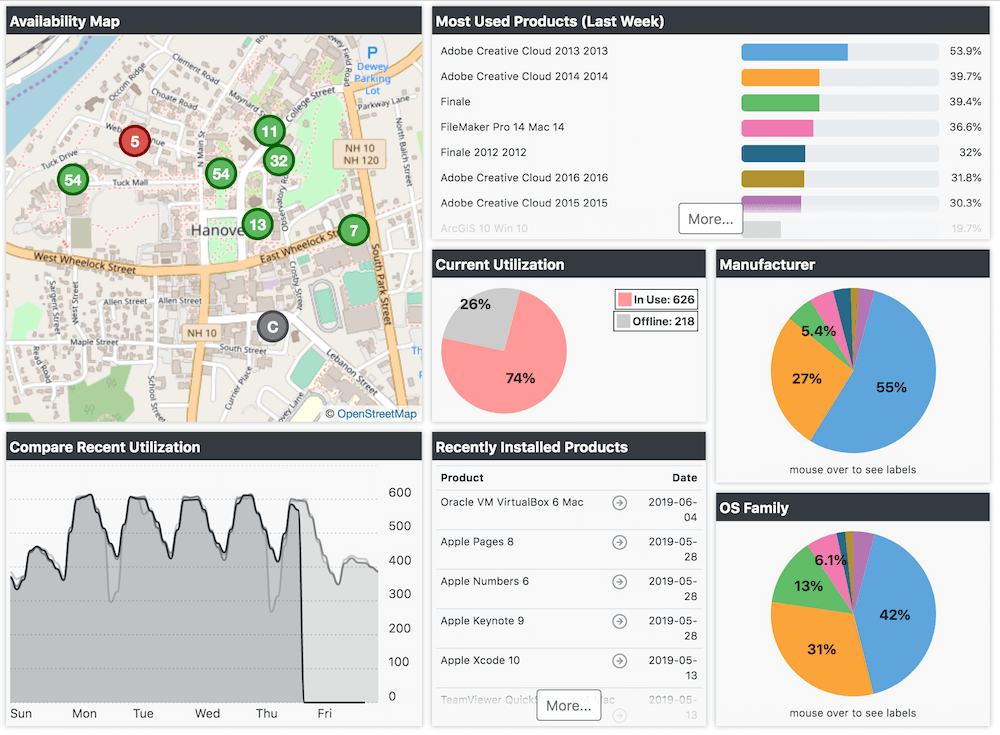
The picture above shows the Default dashboard as it might look on a production system. Note if you upgraded from a pre 7.6 version your dashboard will be different, and you can check out the Lab Manager for the one pictured above. When you first install KeyServer, these widgets will not offer much to look at as there will be no divisions, products, policies, or usage data. The various sample dashboards should give you some ideas of the sort of things you can do, without having to test each and every widget one by one. Ultimately you will probably want to do some customization - our samples may not be precisely what you need.
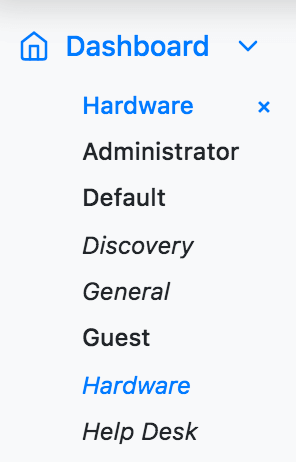
The ⁞ ▾ pull down menu on the far right of the Ribbon has options to save the current Dashboard under a different name for later use, or Erase dashboards you no longer need. All dashboards can be viewed by clicking the disclosure triangle next to the Dashboard menu item in the Side Bar on the left. When you select a dashboard to view, the name of that dashboard will show at the top of the sub menu with an x next to it to signify you're not currently looking at your personal dashboard. Be aware there is no Save or Revert when modifying a dashboard, it is live. If you are an Administrator looking at another dashboard, proceed with caution.
Using the Scope (funnel icon) in the header Bar, you can change the scope of an entire Dashboard to only apply to the computers in a given Section, Division, Map or Tag on the fly. This allows for very fast comparison of data between sub sets of your assets without having to create separate dashboards or tabs. Note that certain widgets respond differently to different scopes. For example, the Availability widget in the Default dashboard can actually change to a given map if you use a scope under the Maps section, but will continue to show the list (or geographic map) of all maps if you choose a division as the scope.
Widgets
Each Widget when you mouse over it will show icons in the title bar. The gear the the most important for configuring the widget. The Camera (if supported) allows you to save an image of the widget contents. The refresh arrows reload the widget data. And of course the x removes that widget.
Configuring a widget will show a variety of applicable options which vary greatly between widgets. Some will have very few options, others will have many. Certain items will be seen often in various widgets, like Scope and Include. As mentioned the Dashboard Scope will cause all widgets to redraw using the data that is in scope. However if a Widget has its own scope options set, that overrides the dashboard scope and the widget will not change. Include options can again vary by widget type, but may offer the ability to filter on things like computer login state, lifecycle stage, and platform.
Availability Widget
Until it is configured, the Availability widget is just a place holder presented to guest users based on the incomplete default configuration. After configuration it is designed to display a graphic view of lab computers showing which are available for login vs those which are not. Its configuration and functionality is somewhat different from most widgets since it depends on certain sections of the Web UI - the lab Map pages for each computer division. Until these maps are drawn, it shows nothing.
To make the Availability widget functional, refer to the Availability Maps documentation – or follow the documentation above to choose a different Dashboard for display to guest users.
Guest Access
By default, Guest access is allowed but will only show the Guest Dashboard (if created), Maps that have been made public, and the Software list. Guests are not allowed to access Computers, Printers, Reports, or Settings, nor are they allowed to customize the Dashboard in any way.
To change the Guest Dashboard, an Administrator with "Change Other Dashboards" privilege in the "KeyReporter Privileges" section of Role Details must log in to the Web UI. The built in Admin account can do this, or any role assigned Full rights or this specific privilege. Expand the Dashboards menu in the upper left of the Navigation pane and click on the Guest dashboard. Any changes you make are saved instantly. When you are finished, you can close the Guest dashboard by clicking the x next to it at the top of the Dashboards list in the Navigation, or navigate back to your dashboard by selecting it in the list. Log out (or better, use a private browsing window) to verify your changes appear as desired under the Guest view.
To disable Guest view access, navigate to Settings - Account Setup and toggle the option, or disable the KeyReporter Guest account in KeyConfigure under Accounts. Note the actual functionality of this account is mostly controlled by the software, so even if you add the Administrator role to this account it will not actually have those rights. Note you can have all users authenticate but still have guest access using the Community account using the settings in Account Setup. If you have users that you wish to grant specific abilities or access to, using Active Directory, Azure, or other integration and assigning roles to external groups is an excellent option at scale.
Further Topics
- Enabling HTTPS (SSL) for KeyReporter
- Embedding Web Objects - Using Widgets and Maps in external websites
- Built-in Reports - List of all reports
- Report Builder Window - KeyConfigure Report building
- REST API for KeyReporter
- Internal vs Exported Data Source
- Table Structure: internal & exported
- Guide to Usage Events
- KSRViewer - Offline Reports Viewer