Web UI Reports
Clicking Reports in the Side Bar navigation of the Web UI will take you to the Quick Reports where you will see 8 popular reports in tile form in the core pane. Each tile has buttons to run the report, or add the report as a widget to your Dashboard.
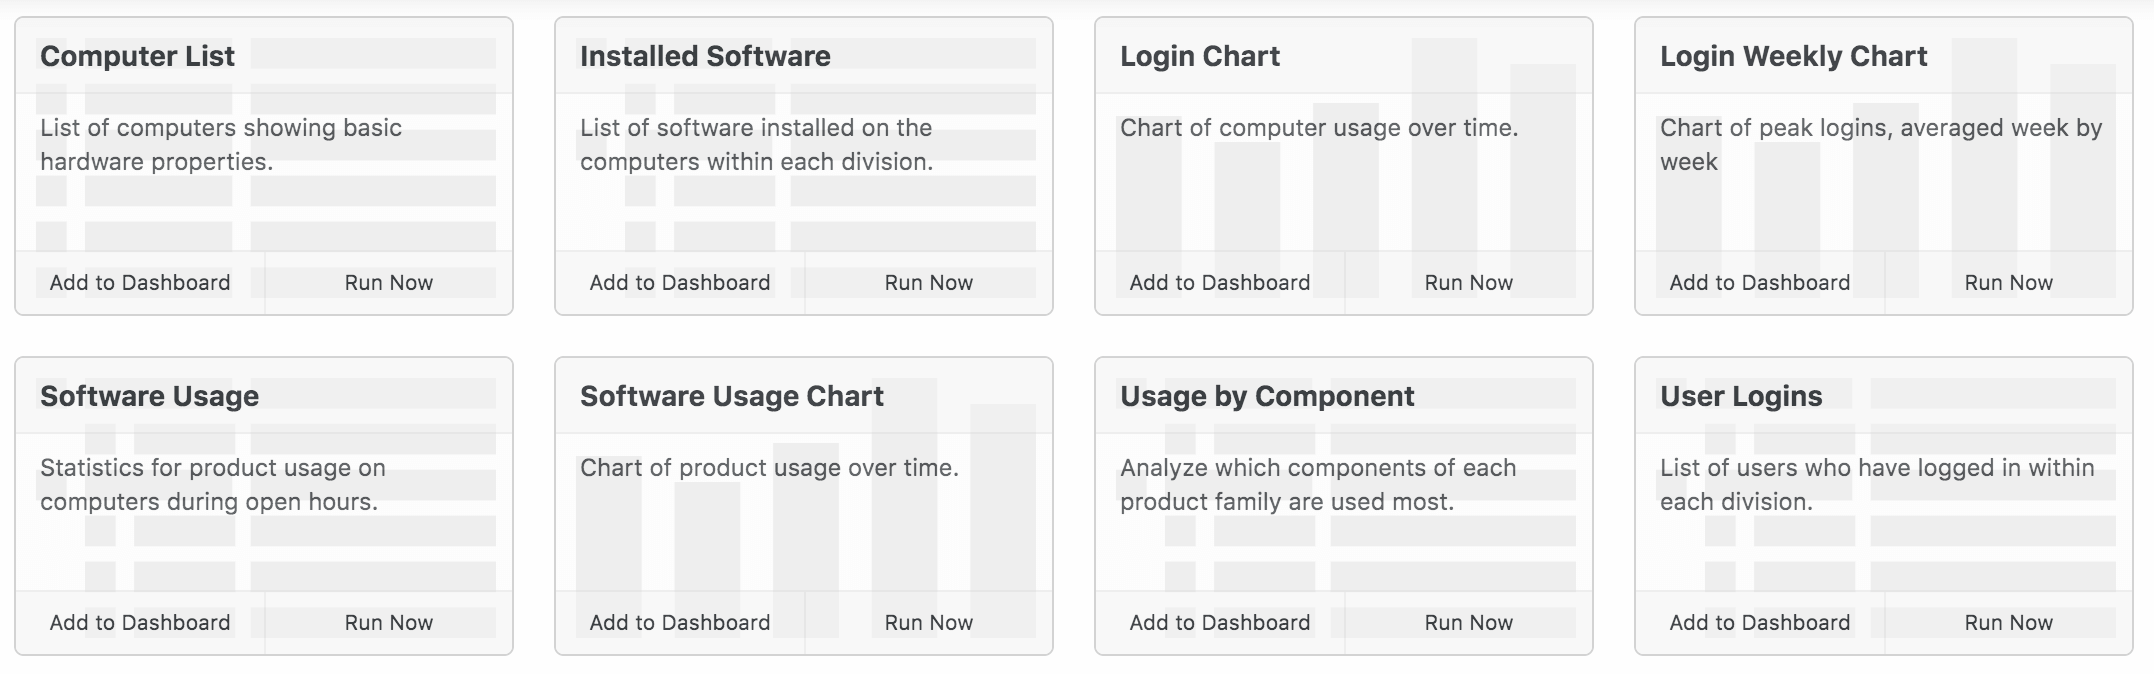
This is an easy way to get in to reports, and once you have sampled these you can move on to building custom reports.
Report Builder
Clicking on Report Builder under the main Reports side bar item will take you to the custom report builder. The intent is to have every bit of power and flexibility that you have in KeyConfigure for report construction, but in a clean modern web UI. See also the Report Builder in KeyConfigure.
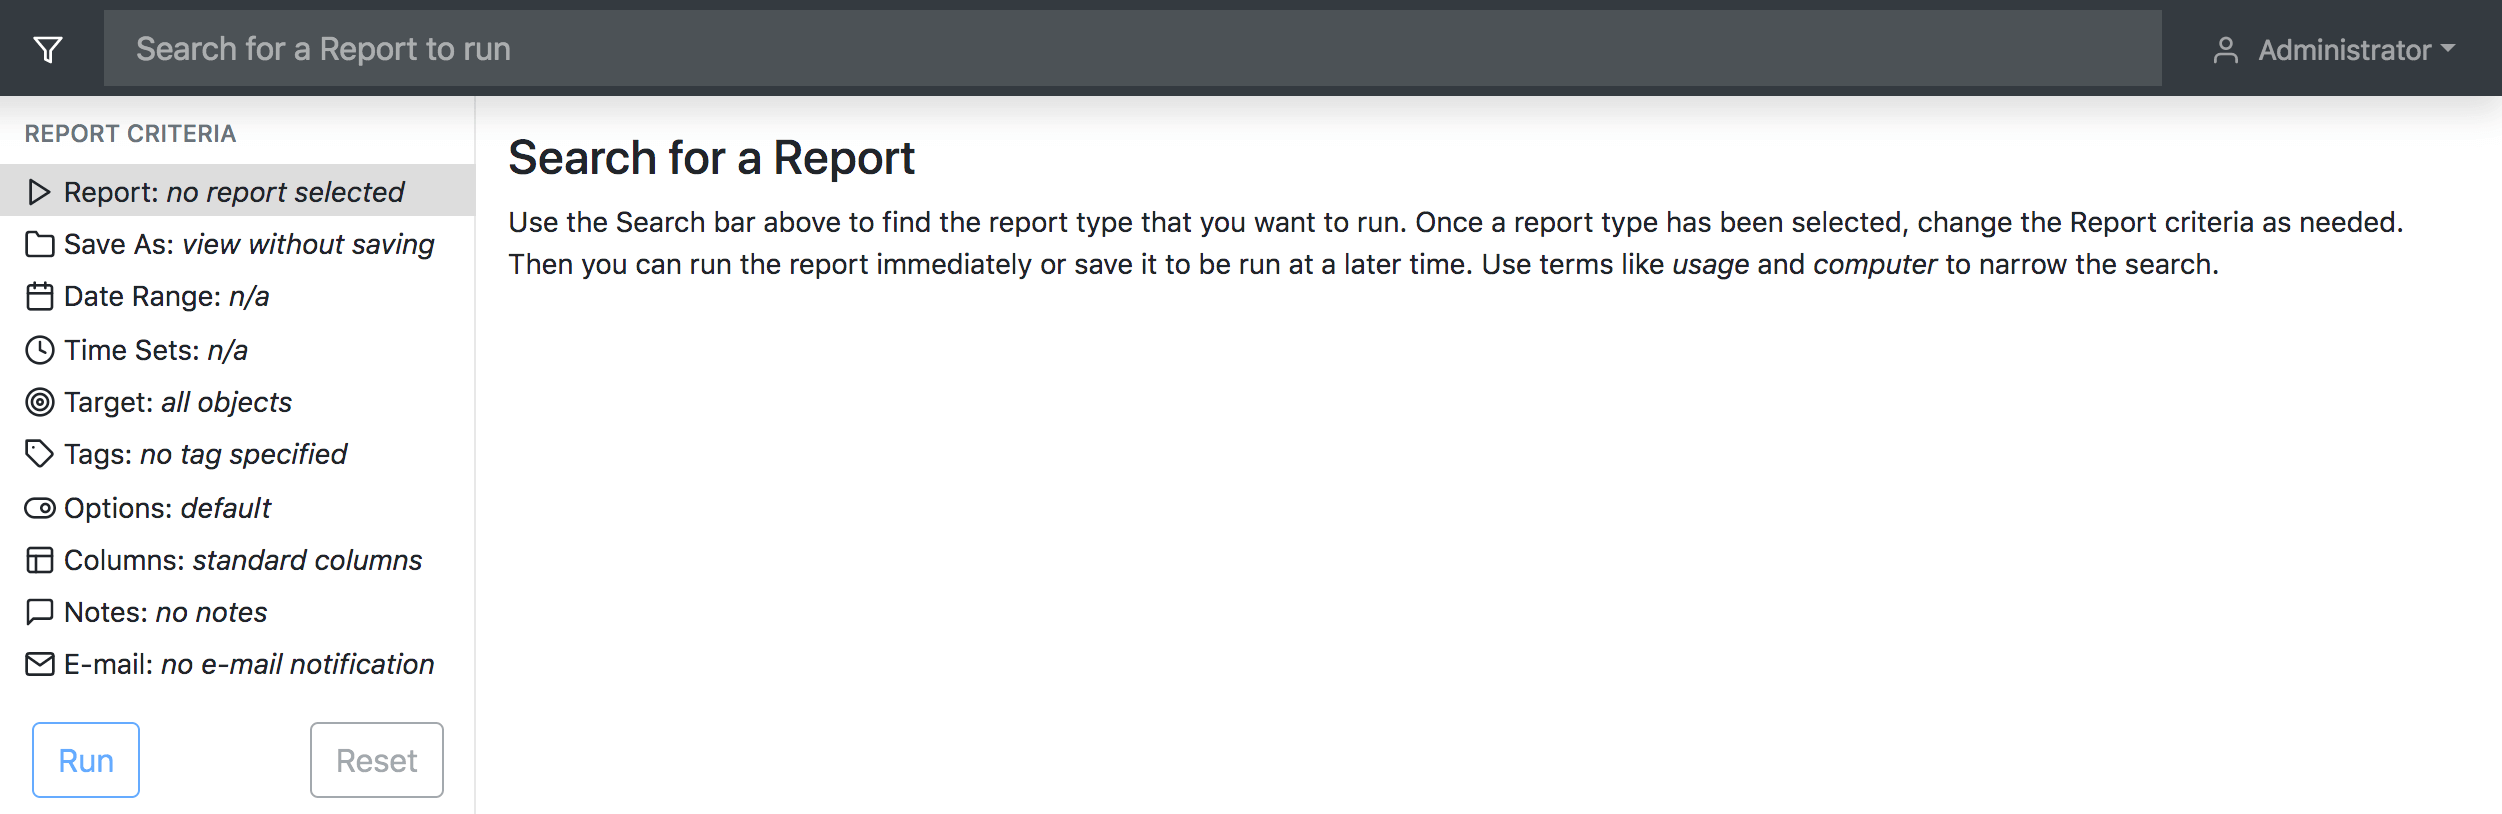
The very first thing you need to do is choose a report type. As the text in the core pane explains, this is done using the Search in the Header Bar. Remember, this is used universally in KeyReport to search for things in the current navigation context, so first we search for a Report and then choose the criteria to build it. The Report Criteria sub pane on the left can lead you through each aspect of a report. Icons and text mark each item, followed by the selection you have made for it.
Report
Very simply, which Report type you want to run. Once you pick a report a short description will be shown in the core pane. You can change the selected report by using the top Search bar to find and pick a different one.
Save As
In this screen you can set several options that have important effects as detailed below. It is important to note that the Scope set in the header bar will apply to the Report you run, much like setting a Target. This has special interaction with Time Sets.
- Display Name - Optional Display Name for the report for later easy reference. This name is not important if you leave the run option as Run Now and do not set a Folder as the report will in no way be saved. Setting this is most useful when you save multiple reports of the same type with different criteria so you can distinguish them from each other later. Five saved reports named Hardware are hard to tell apart, but Hardware: Lab A says what the report targets. This name will also be used in the title of any Widget using this report (like one-click)
- Folder - This is where you want to save the Report results and optionally the report template. If you want to run a report again in the future, giving it a name and saving it to a convenient location (depending who you are saving if for) is recommended. Even if you are only running the report as a one off you may want to choose a Folder to save the results in as it will allow you to sort by columns without the report having to regenerate, and it will enable saving as PDF and KSR as options.
- Uncategorized will result in the saved report only being seen by you and no other admins, regardless of their permissions, and will not save the report results. The exception is the root Administrator account which can always see everything.
- Export is a special option which will save it for ODBC export to an external database.
- One-Click will save it in a folder that also adds the report as a Tile on the main Reports page in addition to the list of Saved Reports. A legacy option for Visible to all Admins will appear when using One-Click. This is locked on by default in newer templates. Note that reports saved in this folder by Administrator can be viewed by other admins, but only edited by Administrator and the account that created it.
- Dashboard is not visible when saving a report, but it is in the Saved Reports page. This folder is used by the Dashboard widgets, so custom reports should not be put here.
- Other folders can be created, as well as setting their ACLs in KeyConfigure to control visibility. By default a new folder made in the Web UI (see Saved Reports below) will be Guest viewable, but you need a link to see a report as the side navigation is not shown to Guests. See E-mail below. If you want full sharing of reports to allow others edit rights, you'll need to make a new folder as the built in folders have special conditions as noted above.
- Run - Controls the execution time and behavior of the report.
- Run Now is the default which simply runs the report and does not save it for later use. Note the results can be saved by choosing a Folder as stated above.
- Run on Demand will save the report in the Saved Reports in the Folder of your choice so you can run it again later. Used with the One-Click Folder, it will result in a tile on the Reports page to quickly run a report any time you want.
- Schedule lets you choose a variety of schedule options on which the report will routinely run. This can be useful for having pre-run report results available at given times, optional ODBC export, and most often used with the E-mail setting below so for example they receive a weekly lab use report.
- If you use Run on Demand or Schedule an additional option will appear for Replace Previous Runs. This is useful for avoiding clutter so that a scheduled report or often re-run report does not create saved copies every time it is run and instead replaces the previous. However, there may be cases where you wish to store an archive of completed monthly reports for example for later reference without having to regenerate them. Note that if you manually run a Scheduled report by any means, that will generate a different completed file from the scheduled run. Also, each person that runs a report will generate a different completed file. Lastly, any time you modify a report and save it with new parameters, it will change to a new completed file. These nuances are by design to keep instances of the completed report clear, but it means a single report could still have multiple completed files despite being set to replace previous runs.
Date Range
This screen lets you pick the date range (if applicable) for the Report. There are several preset ranges and you can build your own range. Any custom date ranges created in KeyConfigure will also appear here. Creating custom ranges for things like semesters can be useful for often re-used dates.
Time Sets
Not to be confused with the Date Range of the report, Time Sets have a special function. These allow you to narrow the report time from 24/7 during the selected date range, to specific days of the week, and hours of the day. One example would be making a time set that is class times in a lab that are distinct from the lab open hours. This would let you run a report of use during the class or classes and compare to overall use of the lab. See the documentation on Time Sets for more details on how to create them in KeyConfigure. You can also create time sets on the fly.
Apply time set of active scope is used exclusively for templates (saved reports) run in the Web UI, typically from One-click Widgets for ease of use. It allows you to run any one click report but apply the Time Set of the active Scoped item (Division/Map) you have selected to the report result. It is on the fly customization of a saved template so to speak.
Apply time sets according to scope can be a complex option to consider. Anything you set explicitly as a Target, or that is an implicit target, comprises the scope of the report. For example, Divisions may have Time Sets associated with them by default (i.e. for setting open hours for Availability). If you know there are time sets in place for the "targets", using this option will auto apply the applicable time sets. For example, a Division based Usage report using this option, regardless of narrowing by explicit Target to only a couple Divisions, will apply their linked Time Sets to their individual result calculations. You can always choose to apply no time sets or different time sets with the other options which then ignores these linked "availability" time sets. This option will be disabled if it does not apply to the report type.
Target
Targeting allows you to filter the report results to the matching target(s). Use the search bar in this panel to look for targets and select them for inclusion. As you add them, they appear in a list, and can be removed by clicking their x. You can only choose targets that match the report type. For example, you can't pick a Division on a Computer based report. For advanced targeting use KeyConfigure.
The Aggregate option will collapse distinct targets into a composite result or grouping. For example, instead of each division or computer you targeted being a separate expandable item under which you had for example Product use (i.e. use by target), you would simply have total Product use of each product for all targeted items (total use of all targets as one). The * is what will collapse to a single item. However some reports allow aggregation on properties/ values, which creates a grouping result. For example, Aggregating on Manufacturer for a Computer based report to see all Dell information as a single aggregated item instead of each Dell computer with individual data.
Note that while the report builder in the Web UI is robust, there may be some very advanced options only available by building a report in KeyConfigure. One such item is the ability to add a Filter to the report Target.
Tags
If you have defined Division Tags in KeyConfigure, they will appear here. These can be used in a similar way to the Computers window in KeyConfigure to filter results. That is, if you Target a Division, then select a Tag, your results will only include the computers with that Tag in that Division. This allows for very granular reporting of systems. Tags are only valid for reports where the tag is of the same type as the primary target. For example, Logins (COMP x user) can only target Computer tags not User tags.
Options
Various report specific options are available here, like ignoring Usage shorter than x seconds and using division from usage event (instead of current division). Note that not all reports will have additional Options.
Columns
Simply, you can choose which columns are shown in the final report. Hardware is a great one to look at for this as it has a lot of available columns, and you may only want a couple of them for a specific purpose. The + and x buttons can be used to add and remove, or simply drag and drop to set which are used and in what order. You can change columns after a report runs as well, but setting the desired columns in a saved report is most convenient.
Note that in KeyConfigure you can add extended columns. That is, columns from the linked data tables that are used for the report. For example, in a Usage of Comp x Prod, you could include the video card of the computers. Reports with advanced choices made in KeyConfigure can be run in the Web UI, but can not be edited without losing the advanced choices.
Notes
These are arbitrary notes you can save in the report as a detailed description or purpose notation. However, if you save as a one-click or use the report in a Widget the notes will show in the widget to serve as a description.
Here you can specify one or more addresses to email the report to (separate with comma or semicolon). This is most useful for sending an alert that a new version of a scheduled report is available. The email will contain a link to the completed report to be viewed in the Web UI. Note that this requires proper access to view the folder the report is stored in (public or authenticated access). Briefly, if you create a new report Folder in the Saved Reports window it will have view access for the Guest view, so using that as the Save location will allow any email recipient to access the emailed link as long as Guest is enabled in the Web UI. You can also have the report attached to the email in a number of formats. Note that Text can often be more useful in Excel than Excel format due to data formatting, depending if you want readability or raw data for manipulation.
Sharing
There is a small ![]() button in the lower left of the report builder sidebar. Clicking this will download a text file that is a descriptor of all the current choices set above in the builder. This can be sent to another user who can drag the file onto this button to load the settings into the builder. In some cases this may be preferable to setting up shared folders for saving report templates which requires ACL configuration.
button in the lower left of the report builder sidebar. Clicking this will download a text file that is a descriptor of all the current choices set above in the builder. This can be sent to another user who can drag the file onto this button to load the settings into the builder. In some cases this may be preferable to setting up shared folders for saving report templates which requires ACL configuration.
Completed Reports
Once a report has been run you will see a few tool options in the Ribbon bar at the top. The available buttons and options will depend on the type of report you ran.

On the Left:
- Name - The name of the report you ran
- Collapse and Expand all - If you ran a report that has a hierarchy, like Program x Computer, you will have these icons to expand and collapse all rows.
- Paginate - This lets you break up the report results into pages or show as one long list.
On the Right:
- Arrange Columns - Change your selected columns and display order
- Views - Invert the arrangement order of the report. For example Computer x program instead of Program x computer. Also change the date and time formats.
- Change Date Range - Rerun the report with a different date range applied.
- More Options
- Create Similar - Return to the Report Builder with the same options selected that created this report so you can make minor changes without starting over entirely.
- Download - Save the results in a variety of formats. Note that KSR and PDF are ONLY available if the report result has been saved (see Folder under Save As above).
- Open in KeyConfigure - Will open the KSR report in KeyConfigure if this was run from a saved report and KeyConfigure is installed.
- Delete - Only shown if the report was saved. This only deletes the saved results, NOT the template. To delete the template go to the Saved Reports list.
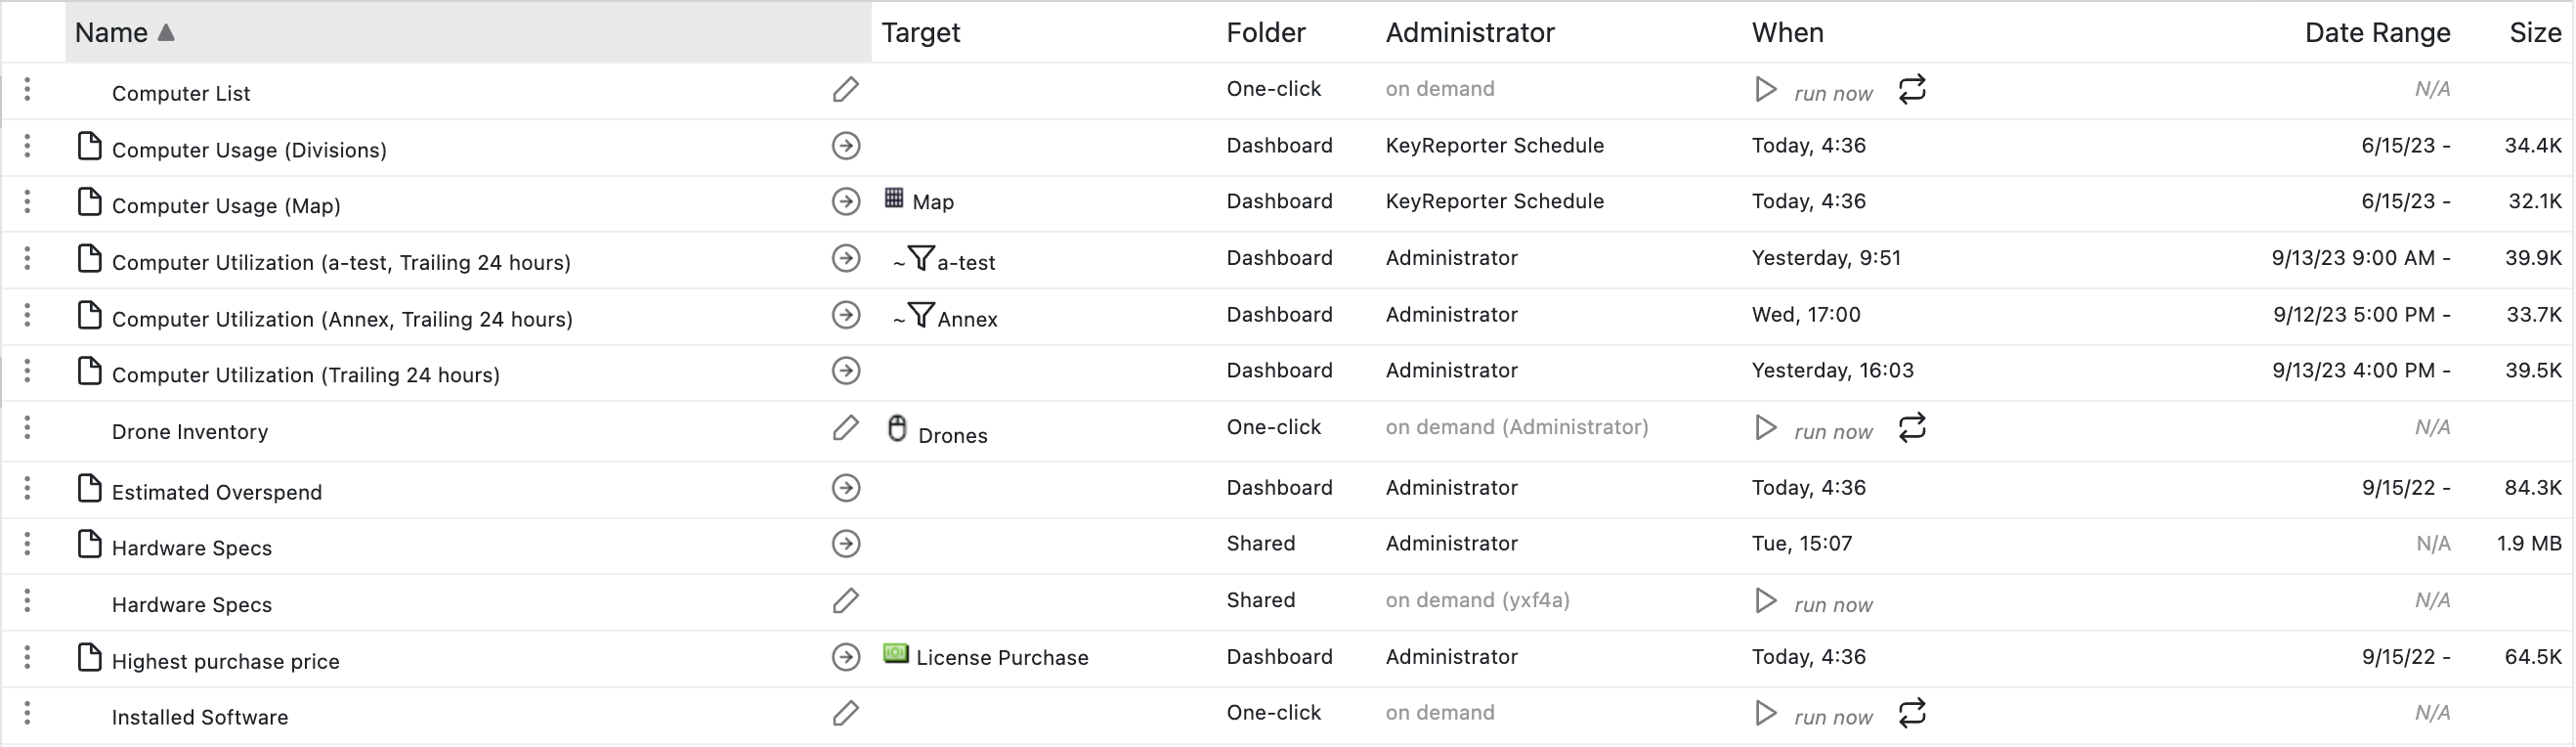
Saved Reports
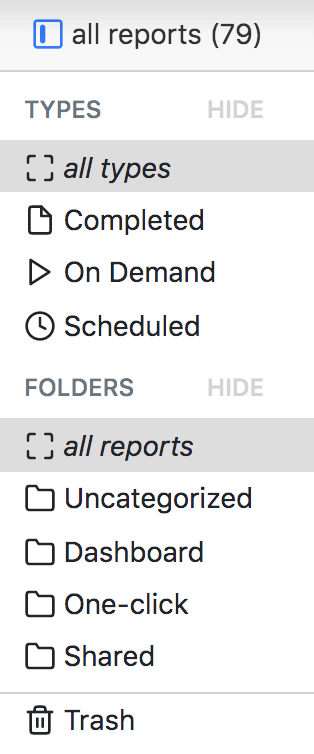
Any report Template you created or report Result that has been saved (see Folder above) will show under the Saved Reports section of Reports in the Web UI. You can filter on the type of report and the folder the report was saved in to narrow the display list. Additionally you can filter on the timeframe the report was created using the drop down in the upper right with the clock icon.
You can drag and drop reports to other folders to move them around. Note Folders must be created (and ACLs set) in KeyConfigure.
You can drag to the Trash and they will be deleted on a clean up schedule. If you hover the item you're dragging on the Trash you will note a small alert icon to the right side. Dropping onto that (will highlight red) will activate a delete immediately option. Mass deleting of reports if often easier in KeyConfigure.
Saved reports will have a variety of options available depending on if they are saved results or saved templates (on demand). You can edit templates, run if they are on demand, and access other options from the popup menu on the left like downloading completed items or creating similar reports based on the criteria.
The Name column may start with a document icon, which per the TYPES filter in the top left signifies a Completed report file (results) as opposed to a template.
The Target column can have a variety of icons.
The Folder is where the report is saved, and the Administrator is who ran it or who it will run under (scheduled reports).
The When column can have a few indicators:
Date Range is simply the timeframe the report will/ does include. Ending in a dash indicates "now", but keep in mind that was "now" as of the time the Completed report was generated.
Sorting by the Size column is useful for cleaning out large saved files on the server that are no longer needed.
Related
For full description of all available reports see Reports.
For a comparison to building reports in KeyConfigure see Report Builder Window.
For managing reports in KeyConfigure see Reports Window.