Built-in Reports
Reports allow administrators to seamlessly summarize usage and audit information, and view internal data in hundreds of ways.
The reports are supported by KeyServer's various databases, which are also accessible externally through the KeyServer ODBC driver, ksODBC, using any reporting tool. The internal reports have the advantage of being integrated into the User Interface. They can be accessed in KeyConfigure or the Web UI.
For steps on building a report see Report Builder Window.
For managing reports in KeyConfigure, see Reports Window.
For easy Report creation, execution, and scheduling, we recommend using the Web Report Builder.
General Information
Report Categories
- Audit – Reports that list programs deployed on each computer or products that contain these programs.
- Chart – Histograms of concurrent usage or logins.
- Configuration – Reports that show basic configuration and association between objects (e.g., Programs in a Product).
- Denial – Reports summarizing program Denial events.
- Hardware – Reports for Computer and Device hardware inventory.
- History – Reports for Computer and Device hardware history.
- Login – Summaries of who logged in where, and for how long.
- Miscellaneous – Reports that may be useful for very specific situations.
- Node Locked – Reports that compare deployment and usage data to policy configuration data.
- Purchase – Reports that deal with Purchase data.
- Summarize – General Summaries of configuration and usage.
- Usage – Two-level usage summaries of program or policy usage.
In the Web UI, when you select a report a short description is shown explaining what the report contains. This is useful for those getting familiar with the platform.
Saving Report Results
Once you run a report you can save the results using the "Save As" menu items from the File menu in KeyConfigure or the context menu in the upper right of the Web UI. Various formats including TEXT (tab delimited), HTML (viewable with a browser), Excel, and XML (for import to other compatible applications) are available in a pull down menu from the save dialog. There is also a special export format, “KS Report Document” or KSR, that offers a compact, single file format for text and graphics that is readable by KeyConfigure (or KSRViewer, the light weight reader tool available from the Misc folder of the full software image).
When a KSR is opened by KeyConfigure (or KSRViewer), the window that is presented will look almost identical to the original report window. Columns can be customized (just like a live report) and the data view can be sorted by clicking on the various column headers. When viewed with KeyConfigure connected to your KeyServer, line items within a KSR report can be double-clicked to connect to the underlying data object in KeyServer. Reports can also be printed from the file menu and saved in other formats.
Programs displayed in reports
Generally speaking, all reports will ignore data from programs which are not part of any product. So, even if a program used to be in a Product in the past, and a Policy caused usage information to be recorded for the program, usage reports will not select launch and quit events if the program now has no product. Presumably if a program has been removed from a product, an administrator has decided that the program is not interesting, so reports should not show information on usage of the program. In addition, Usage related reports will only show programs which are Application components, since that is the only configuration which can generate new usage data. Audit reports also default to showing only Applications, but an option can be specified in the options pane to include all programs. One noteworthy exception to this rule is the Event Dump report, which is designed solely to show an exhaustive list of all events in KeyServer's usage database.
Computer Login types displayed in reports
Most reports will show data from all computers. However, Audit related reports will only show data for computers which are currently Dedicated or Leased. Computers marked as Excluded or Dormant will not appear in Audit reports.
Naming Conventions
The report names are meant to be short, yet understandable and meaningful. We use the following standard abbreviations:
- comp – Computer
- div – Division
- fix – Hotfix
- fldr – Program Folder
- plcy – Policy
- prch – Purchase
- prod – Product
- prgm – Program
- user – User
- pool – Policy Pool (e.g., the name of the Group used as an access restriction for a policy pool as configured in the details of a custom policy)
- path – Path
- sn – Serial Number
These abbreviations are used within parentheses following the name of various reports. If there is only one term, the report will usually generate a flat list. For example, “Histogram (PRGM)” indicates a list of programs. If there are two terms in parentheses, the first term (CAPS font) indicates the summary (header) records. Below the expansion icon for each summary record, the detail records (lower case font) are listed. For example, “Usage (COMP x plcy)” indicates a usage summary, where summary lines are computers, and detail lines are policies — “under each computer, list in detail the policies that were used”. In some cases, there might be a third level of detail, but this will not be referenced in the report name.
Parameters and Interaction
In addition to using the Reports menu, specific reports can be invoked using the context menu attached to any appropriate selection in the user interface. This has the effect of passing the selected item as a parameter to refine the report's scope. The context menu for any selected item will list only those reports which can accept that item as a parameter.
You can also select multiple items. e.g., if you select five computers, then right-click and select a report, it will only contain data from those 5 computers. In this case, the Report Builder Window that comes up will show the 5 Computers in the Target Pane. There is a checkbox labeled “Aggregated”, which will be enabled for most reports. Checking this box will combine usage from all five computers into a single line item (named “*”). Leaving it unchecked will show five distinct entries for the five computers, as always.
Once a report has finished building its display, any item in the report can be manipulated in all the same ways that are familiar in other windows: double-clicking will open the details for the object, items can be dragged into appropriate targets, etc. You can even select a line in a report window and use the context menu to run a “sub-report” on just the selected item.
Most columns in a report will sort when you click in the column header. This is useful for quickly finding the most extreme cases of any particular attribute. For example in a report that lists launches and usage times, sort on the appropriate column to locate the program which is used most often, or the most number of hours. Many reports also have columns which are not visible by default. For example, all grouped reports have an optional column named “Count Details”. This column allows you to see how many details lines are contained under each group line. If you right-click in the column header area, you can “Arrange Columns” to choose which columns to show or hide.
If a report has multiple views, you will see two little arrows next to the report name in the upper left of the report window. Clicking on the report name will bring up a pop-up menu that allows you to change views. In most reports this is used to “flip” the report. For example, if you are looking at a Usage (COMP x plcy) report (which groups by Computer), rather than run the Usage (PLCY x comp) report in order to see the report grouped the other way, simply click on the double arrow icon to switch the view.
As each report is selected from the Reports menu you will see a Report Builder Window where you can typically specify a date range on which to run the report.
If KeyServer data has been exported to an external database server then KeyConfigure's internal reports can be directed to the external data source instead of the KeyServer (assuming you have installed an appropriate odbc driver). This option is available from the Data Source pane of the Report Builder Window. For more information on ODBC as well as further report options, refer to the Report Builder Window documentation.
The following user interface items can be selected for use as parameters / restrictions on reports (via the context menu):
- Computer (from the Computers Window or other windows listing the computer name)
- Computer Login type (from the Computers Window)
- Computer Division (from the Computers Window)
- Computer Section (from the Computers Window)
- Computer Filter (from the Computers Window)
- Policy (from the Policies Window or other windows listing the policy name)
- Policy Folder (from the Policies Window
- Policy Filter (from the Policies Window
- Program (from the Programs Window or other windows listing the program name)
- Program Status (from the Programs Window)
- Program Folder (from the Programs Window)
- Program Filter (from the Programs Window)
- Product (from the Products Window or other windows listing the product name)
- Product Status (from the Products Window)
- Product Folder (from the Products Window)
- Product Filter (from the Products Window)
- Purchase (from the Purchases Window or other windows listing the purchase name)
- Purchase Folder (from the Purchases Window
- Purchase Filter (from the Purchases Window
- Time Set (from the Time Sets Window)
- Tags (from a number of the main windows)
- User (from the Users Window)
Audit reports
- General - Show which Programs are installed on what Computers.
- Baseline and Delta - Show original audit and audit changes as opposed to current audit data.
- Products - Audit by Product instead of Program.
- Summary - Composite collapsed summary of all audit data.
- Hotfixes - Audits of Windows Hotfix packages.
- Optimization - Suggestions for optimal Product based on Program installs.
General Audit Reports
These reports show which programs are installed on various computers. When they are first completed, they are collapsed by default. This is because they may contain huge amounts of information. You can expand any particular group you want to look at by clicking on the expansion icon next to it, or you can right-click in the report window and Expand All. The most basic of these reports are Audit (COMP x prgm) and Audit (PRGM x comp), and they simply show which computers have which programs installed. These two reports are typical in that they only include Application programs. The Options pane of the Report Builder window does have a checkbox to “Include Utilities and Ignored Programs” Other reports group audit entries by path or serial number.
- The “Name” column tells the name of the computer or program variant (as named in the computer or programs window).
- The “Variant” column shows the masked version number for a program or the complete KeyAccess version number for a computer.
- The “Status” column shows the Status icon for a program, just as it would appear in the main Programs Window.
- The “First Seen” column is used in detail lines to show when a program was first discovered on each computer. In summary (header) lines of Audit (COMP x prgm), it shows the most recent audit date (using italic font).
- The “Last Used” column shows the date when the program was last used on a computer. In a summary line, it is the most recent of all the times listed in the detail lines below (note that this information is recorded as part of an audit, so if a computer has recently used the program but has not since performed an audit, the recent usage will not be reflected).
- The “Copies” column shows the number of copies of a particular program which are installed on a particular computer (for detail lines), and for group lines, shows the sum of the values in the detail lines for that group.
- The “Identifier” column shows the Program identifier (for the program family), or for a computer line, the last user of the computer (in italic font).
The Audit (COMP x prgm) report lists, under each computer, all the programs that are currently installed on that computer. This is similar to the information displayed when you select an individual computer and use its context menu item, “Show Installs”. However, the report only shows program variants while the “Show Installs” context menu shows variants which can be expanded to reveal individual distinct versions. This report has the advantage of consolidating the audit for all computers (or a selected Division) into a single window while suppressing unnecessary distinct version details.
The Audit (PRGM x comp) report lists, under each program, all the computers where that program is currently installed. This is similar to the information displayed for a single selected program using “Show Installs” from its context menu. Note: in both cases the “programs” we are talking about here are actually “program variants” — the same items that appear in the Programs window. To list instead the computers where a fully specified version is installed, use the “Version Installs” button in the program details window rather than the “Variant Installs” button (which does the same thing as “Show Installs”).
Audit Baseline and Delta
The Audit Baseline (COMP x prgm) report shows where programs were deployed as of the “baseline” date. By default, the baseline date for each computer is the time of first audit. This can be reset in the Computer Details window. All of the other audit reports show current program deployment based on all the most recent audit data available. You control how “current” to maintain the audit data in the “General Settings...” dialog from the Config Menu.
The Audit Delta (COMP x prgm) report is conceptually the difference between Audit (COMP x prgm) and Audit Baseline (COMP x prgm). It shows what programs have been installed, updated, or removed between the baseline audit date and the current audit date.
Both of these reports have the same columns as the Audit (COMP x prgm) and Audit (PRGM x comp) reports, but they also have additional columns.
- The “Date Stamp” column shows the date which is most relevant to that row of the report. For a computer, this shows the date of the Baseline Audit on the computer. For a program in the Baseline report, it shows the date when the program was discovered on the computer. For the Delta report, it shows the date when a change was observed. If the program was newly installed, this is the date when it was first seen. If the program was uninstalled, this is the date when it was last seen.
- The “Change” column in the Delta report shows what has changed.
- “Installed” means that no version of the program was in the Baseline Audit, but it has since been installed.
- “New Vers” means that there was some version of the program in the Baseline Audit, but since then, another version of the program has been installed as well.
- “Changed Vers” means that there was one version of the program in the Baseline Audit, but since then, it was deleted, and replaced by a different version of the program.
- “Deleted Vers” means that there were two or more versions of the program in the Baseline Audit, and since then, at least one has been deleted, but at least one is still installed.
- “Deleted” means that one or more versions of the program were in the Baseline Audit, but all copies of the program have since been deleted.
- The “Version” column identifies a particular version within the program variant. In the Baseline report, the highest numbered version discovered on each computer is shown. In the Delta report, when a program is added, deleted, or upgraded, the specific program version is shown.
Audit Products
These reports show audit information, organized by product. Instead of simply showing where every program file is installed, they show where products are installed, as indicated by the presence of component programs. This allows you to quickly see which computers likely have certain products installed, and which products seem to be installed on a certain computer. Note that when a program is part of multiple products, these reports will attempt to determine which products are most likely installed, and will only display these products. For example, if all of the Applications within a Suite product are installed on a computer, that suite will be listed, while the individual point products will not be listed. The DIV reports are similar to the COMP reports, but they show what products are installed on any computers within an entire Division.
- The “Name” column tells the name of the computer or product.
- The “Version” column specifies which version of a Product is installed. For a Program it shows the Variant of the Program.
- The “Last Used” column tells when the program was last used on the computer (note that this information is recorded as part of an audit, so if a computer has recently used the program but has not since performed an audit, the recent usage will not be reflected). This will be in italics if older than 90 days.
- The “Copies” column tells how many copies of the program variant are installed on the computer.
Audit Products Grouped
These two reports are similar to the Audit Products (COMP x div) reports, except they group by Tag instead of by Division. They exist primarily to support KeyReporter functionality, but can also be run manually. A Value Tag Target is required for the report to produce results.
Audit Summary
This report summarizes Audit information for all programs (even those not in products). It is similar to a fully collapsed Audit (PRGM x comp) report that has been run with the option to “Include Utilities and Ignored Programs”, but there is one important difference. The Audit report only shows programs which are currently part of an audit of some computer. Audit Summary (PRGM) shows ALL programs, regardless of whether they are currently part of an audit. One additional difference is that Audit Summary (PRGM) includes data from Dormant computers. Other audit reports exclude Dormant computers since they are less interesting and the audit data is older, but here for a summary they are included. This lets you identify programs which are no longer installed on any of your clients.
- The “Name” column tells the name of the program variant (as named in the programs window).
- The “Variant” column shows the masked version number of the program.
- The “Status” column shows the same Status as in the main Programs window.
- The “Last Used” column shows the date when the program was last used on any computer (note that this information is recorded as part of an audit, so if a computer has recently used the program but has not since performed an audit, the recent usage will not be reflected).
- The “Copies” column shows the number of copies of the program which are installed.
- The “Identifier” column shows the Program identifier.
- The “Active” column shows a checkmark if the program is installed on any computers. This column is the default sort.
Hotfixes
These reports show which hotfixes are installed on various computers. The format is very similar to Audit (COMP x prgm) and Audit (PRGM x comp).
Note that once the report has been run, there are view options to change to show missing hotfixes. This is useful to see what computers may need updates applied. It is a comparison against known hotfixes based on computer audits. As such ensure you have a computer with all desired updates applied with a completed audit and a completed Product audit after that has been submitted to make the best use of that view.
Product Optimizations
These reports are useful to identify cases where one product is installed, but a different, related product would be sufficient to satisfy usage demands. Within each Computer group of the Product Optimizations (COMP x prod) view, Products that are actually installed are displayed. Then expanding those products will show a list underneath of the product that could instead be installed (obj) and would still include all programs that were actually used from that product. This report does NOT show all installed products, it only shows cases where an installed product doesn't match the best product choice based on what programs are actually being used. Once run, there are 6 different views that can be selected which order the Product (PROD), computer (comp) and recommended product (obj). For example, here is part of a Product Optimizations (PROD x comp) report.
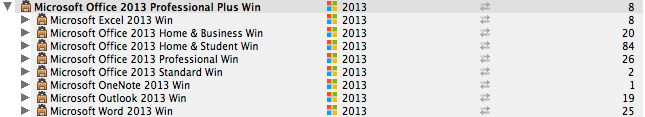
Here, the top level is installed products (PROD). In this case we're looking at one particular product, Microsoft Office 2013 Professional Plus Win. Underneath this are various other products that share some of the same components (obj). This secondary list of products would be sufficient to satisfy usage demands on some of the computers that have the Pro Plus installed. The Count Details columns shows the number of items underneath each group. For the second level products, this count tells how many computers would be revealed by expanding the group entry for the potential alternative product. For example, looking at the bottom of the screenshot, there are 25 computers that despite having all 10 Pro Plus programs installed, have only actually used Microsoft Word. Using this report lets you choose appropriate entitlement counts for various related suites or point products, as opposed to simply buying an expensive suite for every computer on the assumption that it will be used.
Note that in some complex suite cases like Adobe, individual program products (e.g. Acrobat) are the same version across multiple suites (CC 2020, CC 2021, etc). The result of this can create somewhat confusing report entries that make it appear we are recommending a different version that what is installed. In other cases, rebranding can cause confusion, as with Skype and Lync in the MS Office suite.
Unmanaged Products
This report shows Products which are installed on at least one computer, yet have no Policies. These products are candidates to start to manage using one or more policies. Alternatively, if it reveals products that are uninteresting, those products can be set to Ignored, and will stop appearing in this report.
Chart Reports
Chart reports show a graph over time of the data. They are visual as compared to all other reports which are data oriented. Various columns of summary data can still be displayed as well. Note that these reports look better and are interactive when viewed in the Web UI as compared to KeyConfigure.
Daily chart reports
These reports let you see visually a usage pattern throughout the course of an “average” day. When the report is run on usage data spanning several days, all of the 1 PM data is averaged together for the 1 PM display, all the 2 PM data is averaged together for the 2 PM display, etc. Each “bar” of the histogram represents 10 minute of the day. The right side of the window lists each object (policy, product, program, division), and when you click on one, a graph is drawn on the left side of the window. The Daily Logins (DIV) report shows graphs of users logged into computers within the various divisions.
- The black part represents the average (over the various days) of the peak usage values during that hour of the day.
- The red part represents the average (over the various days) of the peak queued values during that hour of the day.
- The first line of Daily (PLCY) says “KeyServer” and will show you a graph of “KeyServer usage” — users logging on to the KeyServer, and logging off again.
- The horizontal axis labels the hours of the day from Midnight to Midnight.
- The name of the selected item on the right is displayed below the graph. If it is a program, it is followed by the version, and either M or W (Macintosh or Windows), and possibly K (Keyed).
- Peak usage and other summary statistics are calculated. For a policy, these statistics include the license limit and maximum length of the waiting queue (for the entire data set selected by the report).
Clicking on the graph (left) portion of “Daily (PLCY)” will toggle between choosing the vertical axis to show the license total (if not infinite), and showing only up to the peak usage. This is useful if the license total is significantly higher than the peak usage, because it magnifies the vertical differences.
Histogram chart reports
These reports let you see visually a usage pattern over the specified time range. The right side of the window lists each object (policy, product, program, division), and when you click on one, a graph is drawn on the left side of the window. The Histogram Logins (DIV) report shows graphs of users logged into computers within the various divisions. Histogram Logins (COMP) and Histogram Logins (USER) are similar but group by Computer or User. Usually these are less interesting since they may simply show alternation between 0 and 1 logins.
- The black bars represent the peak concurrent use during each time slice.
- If there is red drawn, that shows that there was a waiting queue for a policy.
- The first line of Histogram (PLCY) says “KeyServer” and will show you a histogram of “KeyServer usage” — users logging on to the KeyServer, and logging off again.
- Below the histogram, the beginning and end time of the x-axis are printed.
- Next, the name of the selected item on the right is displayed. If it is a program, it is followed by the version, and either M or W (Macintosh or Windows), and possibly K (Keyed).
- Next, there is a series of lines describing highlights of usage, such as peak usage. For the policy histogram, there are more lines, since policies can have a limit, and waiting queues.
Clicking on the histogram (left) portion of “Histogram (PLCY)” will toggle between choosing the vertical axis to show the license total (if not infinite), and showing only up to the peak usage. This is useful if the license total is significantly higher than the peak usage, because it magnifies the vertical differences.
The Histogram reports have many columns which are hidden by default. These are the same columns which are shown in the Summarize reports.
Histogram Lease
This report is much like Histogram (PLCY), but instead of charting live usage over time, it charts allocations of the policy over time. So for a Lease or Node policy, this report gives the graph of the value that is restricted by the license limits. For example, if a seat of a lease policy is in use for 5 minutes but has an 11 minute timer, the normal histogram would show use for 5 minutes but this report would show use for 11 minutes. So while Histogram (PLCY) will give you a better sense of actual usage patterns, Histogram Lease (PLCY) will show you how close to the license limit you actually got over time (i.e. your compliance position). For Node policies one would expect if all 10 seats of a node license were allocated, then the chart would be a constant bar at 10 for the report period because they were all allocated even if not in use.
Histogram Allocations
This report was created to support the Policy Allocation Extra in the Web UI. It is best consumed using that Extra as it is difficult to cleanly use and interpret the report results manually. For example, if the Date range of the report is within a day, the output will show hours of allocations. If the range covers several months, it will be a monthly output instead.
Weekly chart reports
These reports let you see visually a usage pattern throughout the course of an “average” week. When the report is run on usage data spanning several weeks, all of the Monday data is averaged together for the Monday display, all the Tuesday data is averaged together for the Tuesday display, etc. Each “bar” of the histogram represents 1 hour of a day. The right side of the window lists each object (policy, product, program, division), and when you click on one, a graph is drawn on the left side of the window. The Weekly Logins (DIV) report shows graphs of users logged into computers within the various divisions.
- The black part represents the average (over the various weeks) of the peak usage values during that part of the week.
- The red part represents the average (over the various weeks) of the peak queued values during that part of the week.
- The first line of Weekly (PLCY) says “KeyServer” and will show you a graph of “KeyServer usage” — users logging on to the KeyServer, and logging off again.
- The horizontal axis labels the days of the week starting with Sunday.
- The name of the selected item on the right is displayed below. If it is a program, it is followed by the version, and either M or W (Macintosh or Windows), and possibly K (Keyed).
- Peak usage and other summary statistics are calculated. For a policy, these statistics include the license limit and maximum length of the waiting queue (for the entire data set selected by the report).
Clicking on the graph (left) portion of “Weekly (PLCY)” will toggle between choosing the vertical axis to show the license total (if not infinite), and showing only up to the peak usage. This is useful if the license total is significantly higher than the peak usage, because it magnifies the vertical differences.
Configuration reports
The Configuration reports are very simple. Each one shows the relationship between different objects in KeyConfigure.
Config (COMP x devi) shows the Devices associated with each Computer.
Config (PLCY x pool) shows the pools within each policy (most policy types only have a single pool).
Config (PLCY x prod) shows what products are managed by each policy.
Config (PRGM x prod) shows the products which each program is part of.
Config (PROD x plcy) shows what policies apply to each product.
Config (PROD x prch) shows all the purchases for each product.
Config (PROD x prgm) shows the programs which make up each product.
Config Families shows the Edition products that fall under each Family product
Config Sections shows each Division, Policy, and Purchase associated with each Section.
The columns should be self explanatory.
Denial reports
These reports simply show which programs were denied (a user tried to run the program, but was denied because they need a license and could not get one), and how many times they were denied. These reports always involve programs, since that is what gets denied.
- The “Name” column tells the name of the program / computer / division / user.
- The “Variant” column only applies to program lines. It shows the significant digits of the program variant, and also indicates whether the program is keyed.
- The “Type” column indicates the platform for a computer. It is empty for program, division and user lines.
- The “Count” column tells how many times the program was denied.
- The “Last Denied” column tells when the most recent denial occurred.
Hardware reports
These reports are for viewing and managing hardware inventory of Computers and Devices.
Devices shows a list of all device records with the chosen data columns. There are individual reports for each device Category so you can produce a list of just Displays or Printers as desired.
Missing Devices shows a list of devices that have not been seen by any KeyAcces client in more than 30 days.
Computers
This report is similar to the Computers Window, but shows many more attributes of each computer. All of the information displayed can be seen in each individual Computer Details Window, but this report allows all of the information to be seen at once, and will sort the computers by any of the attributes which are displayed. The Computers Window can in fact be customized to show additional values as well, but still, the Hardware report may be a convenient way to quickly see a long list of values for each computer.
If the data in a column is displayed in bold, then the computer ID for the computer is based on that piece of data. For example, if the MAC column for a particular computer is in bold, then the computer ID is the letter “N” plus the MAC address. Most likely, almost all of the computers will be using the same attribute for the computer ID. If the value is also dimmed (medium grey instead of black), then the computer record doesn't actually have a value recorded for this property, but it is displayed in the report since it can be inferred from the computer ID.
Duplicate reports
These reports are similar to the Computer report, but only show computer records which may be Duplicates. Duplicate computer entries occur when a single client computer is unreliable in recognizing hardware properties such as MAC address. KeyAccess on that computer may start out using one computer ID, but then be forced to switch IDs when the hardware properties appear to have changed.
Duplicate MACs (COMP) looks for multiple computers where the MAC address is identical. Duplicate Names (COMP) looks for multiple computers where the Name is identical. Duplicate SNs (COMP) looks for multiple computers where the OEM Serial is identical. At sites where computer names are guaranteed to be unique (based on central deployment or domains), the name based report should be good at identifying duplicate records. But for a site where computer names are not unique, the results are not so meaningful. If the reports give the message “No data to report on”, it means that your data does not contain any duplicate computer entries.
If the data in a column is displayed in bold, then the computer ID for the computer is based on that piece of data. For example, if the MAC column for a particular computer is in bold, then the computer ID is the letter “N” plus the MAC address. If the value is also dimmed (medium grey instead of black), then the computer record doesn't actually have a value recorded for this property, but it is displayed in the report since it can be inferred from the computer ID.
The “Dup?” column lets you sort apart the computers according to what type of entry this report has guessed that they are. If this column is empty for a particular computer, it means that this computer record is almost certainly still in use, and should not be deleted. In Duplicate Names (COMP), if the column contains a question mark (?), then this row shares the computer name with another entry, but has a distinct MAC address. This means that the computer could be a duplicate entry which should be deleted, or it could be a unique entry which simply has the same computer name. For these rows, you should sort by name, and compare this row to other rows with the same name, to see if other hardware properties match or are distinct. If the column contains a red “x”, then this row is almost certainly a duplicate and should be deleted. Not only does it share the computer name with another entry, it also has the same MAC address (or the other entry has a MAC address and this entry has no known MAC address).
These reports are intended to be used in order to identify and delete duplicate computer entries. After running the report, it is recommended that you create a new computer division, to temporarily move duplicates into. Then sort the report by the “Dup?” column. Scroll to the bottom and select all the computers with an “x” in that column, then drag them to the new division. Now you can filter the main computers window to show only those computers in the new division, select them all, and cut them (delete them). Alternatively you can set them to either Dormant or Excluded, so they will no longer take up a KeyServer seat.
Unmanaged Clients
The Unmanaged Clients report (formerly Missing Clients pre 7.8) compares computer names known by KeyServer to computer names known to an LDAP server. This is useful to determine if there are computers at your site which do not have KeyAccess installed, or maybe have KeyAccess pointed to a bad KeyServer address, or are behind a firewall that prevents them to reach KeyServer.
In order to run this report you must enter LDAP configuration values in the Options pane of the report builder. Depending on the operating environment in which the report is run, some or all of the configuration fields can be left blank, and will be determined automatically. For example, running this report in KeyConfigure on Windows where the computer and user account are part of a domain, the LDAP Host value will be the AD server, the LDAP credentials (login and password) will be the logged in user, and the Base DN will be retrieved from Active Directory. In this environment, all of the configuration fields can be left blank. Likewise, if KeyReporter (stand-alone or as part of KeyServer) is running in a domain account on a computer that is a member of the domain, no extra configuration is required.
History reports
Added in 7.9, these reports show history events for Computers or Devices for the Lifecycle, Loan, or Owner change events. These display as 3 tier reports using the two parameters in the report name as well as time. Once completed you can flip the view to any one of 6 different options compared to the two shown in the report menu.
- The "Assigned" column shows when the value was assigned to that field.
- The "Unassigned" column shows when the value was removed from that field/ replaced with another value.
- The "Duration" column shows how long the value was assigned to that field.
- The "Percent" column represents the value in the Duration column as a percentage against the total time of the report time range.
Login reports
These reports summarize Login information within each Division, split out by day, hour, or 15 minute segments (use the “Options” pane in Report Builder to specify granularity). They show maximum concurrent logins (Peak) and/or unique users (Users). The first three reports average these counts across multiple weeks - showing for example “what is the average peak number of logins between 9:00 AM and 10:00 AM on Mondays”. The remaining reports do not average, so will show for example peak usage on each specific day in the time range you run the report on.
These reports are formatted in two different ways. All of them group first by Division. The two “Counts” reports show specific days (or hours or 15 minute segments) on the detail lines, and each detail row shows both the Peak logins and Unique Users. The “Peaks” and “Users” reports use columns to arrange data by days of the week - so these reports only show Peak logins (in the seven day columns) or Users. Again, detail rows are for time segments, but there are 7 times fewer detail rows than in the “Counts” reports, since these samples have been “wrapped” into day columns.
The “Counts” reports when saved as text or XML should provide data that is easy to manipulate with Excel. The “Peaks” and “Users” are designed to be easier to read on screen, and might be less appropriate to provide data to Excel.
Almost all of these reports round the specified time range out to complete weeks. This is because the Average reports are averaging across weeks, and the Peaks and Users reports present a complete week as multiple columns, one per day. The one exception is the Login Counts (DIV) report, which only rounds to complete days, since it is not doing anything related to weeks.
For the “Peaks” and “Users” reports, when you select a granularity of “Hour” or “15 minutes” you can also limit output to certain hours within each day. Specify “from” and “through” hours from 0 to 23.
- The “Name” column shows the name of the division or time segment.
- The “Peak” column shows the maximum number of concurrent logins during each time segment.
- The “Users” column shows the unique number of users who logged in during each time segment.
- The “%” column shows the count of computers in a division (on the division line) and the percent of Peak / Total computers, for each time segment line.
- The “Count” column shows the count of computers in a division.
- The “Sunday” - “Saturday” columns show statistics specific to those days of the week.
Logins
These reports summarize Login information. They show who logged in from where, and for how long.
- The “Name” column shows the name of the computer, division, or user.
- The “Type” column shows the client platform: Windows or Macintosh.
- The “Total Time” column shows the total login time (hours:minutes). For a summary line, it is the total login time for all the detail lines listed below the expansion icon. For a detail line, it is the total login time for that particular detail record.
- The “Total Count” column shows the number of sessions (logout events) which are summarized on the line.
- The “Avg Time” column shows the average login time per week (hours:minutes). If the report is on less than half a week, this field shows “N/A”, since an average would be misleading.
- The “Avg Count” column shows the average number of sessions per week. If the report is on less than half a week, this field shows “N/A”, since an average would be misleading.
- The “Last Session” column shows the time of the last logout. This does not give you any information on a currently active session, if any.
- The “First Session” column shows the time of the first logout.
- The “% Usage” column indicates for example in the COMP x user report what percentage of the total time for the Computer was represented by the User.
- The “Active Time” column indicates in Hours:Minutes how much time was Active (user input within Idle setting). Useful in conjunction with Idle Time and Total Time.
- The “Idle Time” column indicates in Hours:Minutes how much time was Idle per the Idle setting in General Settings. Useful in conjunction with Total Time to evaluate actual use vs total login time.
- The “% Remote” column indicates by percentage how much of the Total Time was from Remote connections (RDP).
- The “% Remote Logins” column indicates by percentage how many of the Total Count sessions were Remote (RDP).
- The “Longest Session” column indicates by Hours:Minutes the duration of the longest single session.
- The “Avg per use” column indicates by Hours:Minutes the average time spent on a session (compare Total Time and Total Count)
- The “Utilization Score” column is only available in Logins reports where computer is a parameter. It expresses the percentage of time the session was logged in as a ratio of the total time of the report range (available time).
- The “Active Utilization Score” column is only available in Logins reports where computer is a parameter. It expresses the percentage of time the session was logged in and active (not idle) as a ratio of the total time of the report range (available time). In effect, this is the "true use" of the computer for the date range when evaluating the utilization of hardware.
Logins OS Percent reports
These reports are identical to the standard Logins reports except that they have additional columns describing what percent of logins occurred as different platforms. This is useful for understanding how “Dual Boot” computers are being used. Note that Virtual Computers have their own computer records in KeyConfigure, and there is no easy way to correlate which Virtual Computers are being run on which Physical computers. The standard columns show percents by duration. For example if “Total Time” is 4:00 and “% Mac” is 25%, then the logins totalled 4 hours, and 1 hour of this was on Mac. There are optional columns which will show percents of counts. For example, if “Total Count” is 10 and “# % Mac” is 60%, then there were 10 total logins and 6 logins on Mac.
Miscellaneous reports
Event Dump
Event Dump is the most detailed report on usage information. As such, it is probably not generally that useful, but is extremely valuable in certain situations. It shows, in chronological order, one line for every single event which KeyServer records. All events relate to Server startup/shutdown, Computer audit, client activity, Program launch/quit, and Policy usage.
Caution: on a KeyServer supporting thousands of clients with heavy usage data going back several months, the Event dump might require several gigabytes of memory space to hold perhaps many millions of event records. In order to avoid virtual memory thrashing, you should always run the Event Dump report on a limited data set. Restrict to a specific time period of interest, and/or select a specific Computer, Program, or Policy. Use its context menu to run the report — this will download events concerning only the selected item.
- The “Name” column shows a name which is associated with the event. For server events, it is simply “KeyServer” (the name as configured in KeyConfigure appears in the “User” column). For logon/logoff events, it is the computer name. For programs, it is the program variant name. For policies, it is the policy name. This name, and the icon next to it, shows what details window will be opened when you double-click that line in the report.
- The “Vers” column shows the version of the KeyServer process, the version of KeyAccess which was used to log on/off, the version of a program, or the license total and type of a policy.
- The “Event” column shows a short name for the event type. For program events, the icon for the program action is also shown. Note that the icon may not agree with the event type. The event type was recorded when the event occurred, while the icon simply tells the current action for the program. For example, you may see a gray diamond for a logged launch event. This simply means that at the time of the event, the program was Observed, but now it is Ignored.
- The “Why” column shows a short description of why the event occurred.
- The “Product” column shows the name of the relevant product. This field has a value for launch and quit events.
- The “Policy” column shows the name of the relevant policy, in the case of program launch events, and shows time at which the event began, for all “end” type events (shutdown/logoff/quit/return).
- The “When” column shows when the event occurred. This is the column on which the entire report is sorted by default.
- The “User” column shows the name of the user who triggered the event.
- The “Address” column shows the address of the computer on which the event occurred, at the time at which it occurred.
- The “Computer” column shows the name of the computer on which the event occurred.
- The “Extra” column shows the name of the group which enabled the usage event, if there was one.
This report can be given any of the five types of parameters (computer/product/program/policy/user). Regardless of parameter type, server events are always shown.
- If a computer is the parameter, all events on that computer are shown (user events, policy events, program events, audit events).
- If a program is the parameter, all events of that program are shown (only launch/quit events).
- If a product is the parameter, all events of that product are shown (only launch/quit events).
- If a policy is the parameter, all events pertaining to that policy are shown (policy events, and program events which were recorded because of the policy).
- If a user is the parameter, all events for that user are shown (logon events, policy events, program events, audit events).
Under a few conditions, lines will be highlighted in red. These are events where something is wrong. These are the specific conditions:
- The policy no longer exists. In this case, “Policy Not Found” will appear in either the “Name” column (for a policy event), or the “Policy” column (for a program event).
- The program is no longer known to the KeyServer (it has been manually deleted, or the programs table was deleted entirely). “Program Not Found” will appear in the “Name” column.
- This is a server startup event, and there is no server shutdown event in between the last startup event and this one. Thus, the server must have crashed at some point in between.
Lease Simulator (PLCY)
This report helps you determine how many copies of a license you would need if you changed the policy to a lease policy. When it runs, it looks at historical policy usage, and simulates what would have happened if the policy had already been a lease policy, and there were allocations of a lease, using different lease durations. You can run this report on any date range, but the longer the range you use, the more meaningful it will be. The format of the report is very simple: there are columns for various lease durations, so for each policy, you can see what the peak allocation would have been assuming those different durations.
Path Browser
The Path Browser report shows Programs organized in a path hierarchy based on the Sample Path where each Program was first discovered. While this sample path may not in fact be the common path that results from a standard install, it is often the standard path, and so the report mimics what you would see “on disk” if a single computer had all known programs installed on it.
Product Suggestions (PROD)
The Product Suggestions report looks for Manually defined Products that might correspond to an Automatic Product defining the same thing. A Manually defined Product is one that a KeyServer Administrator at your site has created using the New Product wizard. An Automatic Product is one that was defined by Sassafras Software and downloaded by the Product Recognition Service.
If an application program appears in both a Manual product definition and an Automatic product definition, the report will suggest the Automatic Product as a possible replacement. But for suite products, noticing a single application in common is a long way from claiming the definitions actually correspond, so you must examine any suggestion carefully before accepting it as a replacement! When an Automatic product is in fact a good match to your Manual product, often it is more accurate in specifying program variants or more complete in listing Utilities. Also, if the Sassafras Server discovers a misconfiguration of the Automatic Product definition at some future date, PRS will automatically update the definition.
The output of the Suggestions report shows Manually defined Products on group lines, and within each group, one or more Automatic Product suggestions are listed. If a Manually defined product has been carefully defined and is very close to matching a PRS definition, then you might see just a single Automatic product listed underneath. If the Manually defined product is a suite which Sassafras Software has not yet defined, but Sassafras Software has defined the related point products, you will see all those point products listed.

![]() When your KeyServer Data Folder has a long history of upgrades going back to version 6.2 or older, the upgrade process may have created a catch-all product named “(6.x ->logged Product)” consisting of all the logged programs from the legacy KeyServer. The Suggestion report may list many Automatic products as a candidate replacements just because each one shares at least one program file. But a quick examination reveals that none of these suggestions are a good match! Very often, the “(6.x ->logged Product)” serves no current purpose and can be deleted entirely or replaced by a more carefully constructed Manual product that focuses on just a few programs that are not already logged due to other Policies.
When your KeyServer Data Folder has a long history of upgrades going back to version 6.2 or older, the upgrade process may have created a catch-all product named “(6.x ->logged Product)” consisting of all the logged programs from the legacy KeyServer. The Suggestion report may list many Automatic products as a candidate replacements just because each one shares at least one program file. But a quick examination reveals that none of these suggestions are a good match! Very often, the “(6.x ->logged Product)” serves no current purpose and can be deleted entirely or replaced by a more carefully constructed Manual product that focuses on just a few programs that are not already logged due to other Policies.
Once you have carefully examined the Product Details window for a Manually defined product, as well as the suggested Automatic products, you might decide that you want to use one (or more) Automatic products instead of your Manually defined product. The Replace Product References wizard makes such a switch easy, updating all references in Purchase and Policy records as necessary. From the Suggestions report select a Manual product. With the Automatic product suggestions exposed underneath, you can also select a replacement. Then right click to run the context menu item, “Replace Product References”. The wizard will open with your selected items filled in!
Great care should be taken when using the Replace Product References wizard since the changes are not easily reversible!

![]() Automatic Products never include keyed variants as part of the product definition, so if your Manual Product has a keyed Application component, you must manually add this component to the corresponding Automatic Product after the Replace Product References wizard completes. Note: while the PRS will occasionally update an Automatic Product if necessary, such an update will never add or remove any keyed variants from the definition.
Automatic Products never include keyed variants as part of the product definition, so if your Manual Product has a keyed Application component, you must manually add this component to the corresponding Automatic Product after the Replace Product References wizard completes. Note: while the PRS will occasionally update an Automatic Product if necessary, such an update will never add or remove any keyed variants from the definition.
It is common to see a Manual product defined to include not only the most recent program variant but also all older variants in order to facilitate “backward coverage” whenever the product is managed by a Policy (e.g., so that older program variants are allowed to continue being used until upgraded). When adopting an Automatic product in place of a Manual product a different method for handling “backward coverage” is required. In Policy records (but not Purchase records), the replace wizard can replace the selected Manual product with multiple Automatic products. In fact the Suggestions report supports selection of multiple Automatic products to replace your single Manual product selection for just this reason. The most recent Automatic product will be used as the “primary” replacement in any affected Policy and also in any affected Purchase record, so the reconciliation balance (or imbalance!) between purchases and policies is preserved by the replacement.
Reconcile (PROD)
The Reconcile computes the Entitled count for each Product/Metric, from all relevant Purchase records. It compares this to the Managed count which is computed from all relevant Policy records. The numbers presented in this report match the output of the Reconcile Window. The Reconcile Window is more interactive, but the Reconcile report can be saved as a KSR.
Session Dump
Session Dump lists a single line for every KeyAccess session with KeyServer. Columns display the Computer, User, time of Logon, time of Logoff, Duration, and Address.
Shadow
This report shows a list of shadows that served at some point in the specified time period.
- The “Address” column shows the address of the shadow.
- The “Total Count” column shows how many times the shadow served.
- The “Total Time” column shows how long the shadow served for (hours:minutes).
- The “Avg Time” column shows how long the shadow served, as an average per service interval (Total hours:mins / Total count).
Statistics (PROD)
The Statistics (PROD) report gives a summary of audit and usage statistics for managed products.
- Name — the product name.
- Version — the product version.
- Status — the reference status of the product.
- Publisher — the product publisher.
- Installs — the number of computers on which the product is installed.
- Distinct — the number of computers on which the product has been used (usage recorded in the Usage Log).
- Distinct Online — the number of computers that have used this computer while connected to the server.
- Distinct Offline — the number of computers that have used this computer while off network.
- Launches — the total number of launches of a program within this product.
- Launches Online — the total number of launches of a program within this product while connected to the server.
- Launches Offline — the total number of launches of a program within this product while off network.
- Total Time — the total accumulated time that a program within this product has been used, shown as hours:mm.
- Total Time Online — the total accumulated time that a program within this product has been used while connected to the server, shown as hours:mm.
- Total Time Offline — the total accumulated time that a program within this product has been used while off network, shown as hours:mm.
- Total Seconds — the total accumulated time that a program within this product has been used, shown as the number of seconds.
- Total Seconds Online — the total accumulated time that a program within this product has been used while connected to the server, shown as the number of seconds.
- Total Seconds Offline — the total accumulated time that a program within this product has been used while off network, shown as the number of seconds.
The data presented in this report is available separately in other reports, possibly with more detail. This report brings some simple and commonly needed statistics into one place, with no extraneous information.
Suite (PLCY x prgm)
This report shows you a summary of policy usage, including program usage. The group headers are policies, and show usage summaries for each policy over the time period. The details are programs, and show usage summaries for the program, in the cases where it was enabled by the particular policy.
- The “Name” column shows the name of the policy, product, or program
- The “Variant” column shows the version of the program (with the keyed symbol, if appropriate)
- The “Computers” column shows a distinct count of the number of computers on which the policy or program was used.
- The “Total Time” column shows the total usage time for the policy or program (hours:minutes).
- The “Total Count” column shows the number of times the policy or program was used.
- The “Avg Time” column shows the average usage time per week (hours:minutes). If the report is on less than half a week, this field show “N/A”, since an average would be misleading.
- The “Avg Count” column shows the average number of uses per week. If the report is on less than half a week, this field shows “N/A”, since an average would be misleading.
If the same program is managed by multiple policies, it may appear on multiple lines in the report, under different policies.
It is important to note that the header lines do not necessarily show a sum of the detail lines. They show a usage summary for the policy. So if it is a suite policy (one which manages multiple products), the policy usage total may be less than the sum of the program usage totals, since computers may have used multiple programs at the same time. Likewise if a policy manages a single product but the product is a suite product with multiple programs, the Suite (PLCY x prgm) report may show multiple detail lines which don't add up to the group line. This is different from most reports, where instead each group line is a summary of the details below it.
Upgrade Discoveries (PRGM)
This report is designed to help identify Program Variants for which you are likely to want to define a Product. It shows Program Variants that are not currently an Application in any Product, but for which an earlier version in the same program family IS an Application in a product. It is likely that these newer versions should in fact be configured as an application in some product. Note that there is a widget in KeyReporter (“Upgraded Programs”) that shows the same programs that this report shows. It may be more efficient to include this widget in your dashboard and watch for newly discovered programs, than to manually run this report from time to time.
Upgrade Discoveries (PROD)
This report is designed to help identify Products for which you are likely to want to define a Policy. It shows Products that currently have no Policy, but for which an earlier version of the same product DOES have a policy. It is likely that these newer versions should in fact be configured with a Policy. Note that there is a widget in KeyReporter (“Upgraded Products”) that shows the same products that this report shows. It may be more efficient to include this widget in your dashboard and watch for newly discovered products, than to manually run this report from time to time.
Node Locked reports
These reports show information related to Node policies only. They show where node-locks have been allocated, where programs which are managed by node-lock policies are installed, and where these two conditions do not exactly correspond.
There are three basic cases which are represented in these reports.
- A computer has a node-lock allocated to it for a policy. It also has at least one program which is managed by the policy installed, and furthermore, that program has been used recently. This is the “normal” case, where node-locks have been allocated correctly.
- A computer has a node-lock allocated to it for a policy, but does not have any programs installed which are in a product managed by the policy. This may happen if an administrator allocated node-locks manually, before installing software on the computer, or if a computer used a program once, but has since uninstalled the program. In this case, the node-lock is not necessary. In the same category are cases where the program is installed but has not been used in over 90 days. These are likewise candidates for removing the lock.
- A computer has a program installed which is in a product managed by a node-lock policy, but the policy has not been allocated to the computer. This may happen if the program has been installed, but not yet used (or if a standard image installs the same program on all computers, regardless of whether it is needed on each computer). In these cases either the policy should be locked or the program should be uninstalled.
Both reports show exactly the same information, but organize it in different ways. Since a single policy can manage multiple products containing multiple programs, there is a third level of detail showing the program or programs that are actually installed that correspond to each particular policy/computer pair. The mid-level line (computer or policy) shows the status for that computer/policy pair. The top-level line shows an overall status for that computer or policy, which summarizes and generalizes the status of the mid-level lines below that top-level line. Note that these reports get “Last Used” information from audit and Node Locked records — they do not directly access usage data. The only time Usage events would differ significantly from the data used here is if a policy has been recently created.
- The “Name” column tells the name of the computer, policy, or program.
- The “Variant” column specifies which variant of a program is installed on a computer.
- The “Issued” column shows how many policies are issued (locked to computers).
- The “Limit” column shows the policy limit.
- The “Status” column shows the status for the line. For a top-level line, it is a summary which essentially indicates whether the configuration of that policy or computer needs any attention or whether it is correct as it is. For a mid-level line, it shows two pieces of information. First, it may or may not have a checkmark icon in it. If it does, the policy is locked to the computer. Second, it has a short string describing the status of the policy allocation for the computer, and perhaps suggesting what you may want to change about the policy allocation. For a complete description of each status code, see the next section. If this field is highlighted in red, it is one of the “non-standard” cases, and you may want to change how policies are allocated.
- The “Last Used” column tells when the program variant was last used on the computer. This can help you decide which policies to reallocate.
- The “Copies” column tells how many copies of the program variant are installed on the computer.
Top-level Status strings:
- “OK” – this is the general category for top-level lines where everything seems to be configured properly.
- “Unclear” – this is the general category for top-level lines where a node-lock policy manages software which is also managed by a non-node-lock policy. In such cases, it is hard to tell whether any given computer needs to have the Node policy locked, since it might be possible for it to also use the non-Node policy.
- “Optimize” – this is the general category for top-level lines where policies are allocated to computers that don't seem to be using them.
- “Reconcile” – this is the general category for top-level lines where policies are not allocated to computers even though software managed by the policy is installed on those computer. Note that “Optimize” takes precedence over “Reconcile”. That is, if some policy can be unlocked from some computers, and at the same time, other computers have the software installed, so it should be uninstalled, the Status for the policy will be “Optimize” since this is the more interesting action to take. If the policy is Optimized, and then the report is run again, it will then show Reconcile.
- “Over-limit” – this is the general category for top-level lines where policies are set to Enforcement: None, and in fact have more copies Allocated than the configured Limit. This takes precedence over both “Optimize” and “Reconcile”, since it is a state which should be corrected.
Mid-level Status strings:
- “locked” – this is the “normal” case for a mid-level line. The policy is locked to the computer, and a program managed by it is installed. This falls under the general category “OK”.
- “locked other” – a program managed by this policy is installed, and this policy is not locked, but at least one other node-lock policy which manages the same program IS locked on this computer. This falls under the general category “OK”.
- “used non-node” – a program managed by this policy is installed and this policy is not locked, but the computer has used a different, non-Node policy to manage use of the program, so presumably the computer does not require the Node policy to be locked. This falls under the general category “OK”.
- “licensed other” – a program managed by this policy is installed, and this policy is not locked to the computer. There is a non-Node policy which manages the same program, but it is unclear whether the computer has or could use the other policy. This case is complex enough that the admin should look at the policy configurations and decide which one is relevant to this computer. This falls under the general category “Unclear”.
- “redundant lock” – a program managed by this policy is installed, this policy is locked to the computer, and in addition, another Node policy managing the same program is also locked to the computer. One or the other policy should be unlocked since it is redundant. This falls under the general category “Optimize”.
- “unlock” – the policy is locked to the computer, but no programs managed by the policy are installed. Or, the policy is locked but has not been used in over 90 days, and the computer is set to not audit, so it is not known whether or not the program is installed. If you are not going to install the programs in the near future (and you know the program is not being run off a network volume), you could unlock the policy from this computer. This falls under the general category “Optimize”.
- “unlock / uninstall” – the policy is locked to the computer, programs managed by the policy are installed, but have not been used in over 90 days. Therefore, if you know the policy is no longer needed on this computer, you should unlock the computer, and uninstall the software from the computer. This falls under the general category “Optimize”.
- “uninstall” – a program managed by the policy is installed, but the policy is not locked. The audit shows that the program has not been used in the last 90 days, so the software should probably be uninstalled. This falls under the general category “Reconcile”.
- “lock” – a program managed by the policy is installed, but the policy is not locked. The audit shows that the program has been used recently, so the policy should probably be locked. You will generally only see this status if the program was recently changed to managed, or if an admin has removed this computer manually from the node list for the policy. This falls under the general category “Reconcile”.
- “lock somewhere” – this is exactly like “lock”, except that there are two or more Node policies that manage the program, so you may want to lock a different policy than the one you are looking at. This falls under the general category “Reconcile”.
Purchase reports
The reports all relate to the Purchases window. If you do not input purchase records, these reports will serve no function.
Assignments
Similar to Compliance but does not actually attempt to validate compliance. Rather, this report simply looks at Purchase, Policy, Audit, and Usage data to attempt to show allocated seats of software to computers. For column meanings see the below compliance report sections. Because it is not evaluating compliance, this report may show assignments that do not appear in the Compliance reports.
Compliance (PROD)
The Compliance report looks at Product configuration, Purchase records, Policies, Audit data, and Usage data. It compares purchase data to all of the other data in order to determine compliance. The columns are as follows:
- Name: the name of each Product
- Version: the version of each Product
- Metric: the metric that is relevant to this line of the report. Note that if a single Product has been purchased with two different license Metrics, the report will contain two lines for that Product, one for each Metric.
- Publisher: the publisher of each Product.
- Entitled: the number of active entitlements, determined solely from Purchase records.
- Managed: the number of entitlements being managed by Policies.
- Legacy: the number of active entitlements in Purchases marked as “Legacy” (such entitlements will not be considered in the determination of any entitlement surplus).
- Deficit: when more entitlements are being used than have been purchased, the difference in these two numbers.
- Surplus: when not all purchased entitlements are being used, the number of extra entitlements. This value is the Entitled count less the Consumed value.
- Liability: when there is a Deficit, this is the projected cost to true up against the Deficit.
- Overspend: when there is a Surplus, this is the projected cost savings as a result of the Surplus.
- Consumed: the number of entitlements that are considered consumed. This number is determined differently depending on the metric:
- Site: the consumed count is not determined for Site policies, and no Deficit or Surplus is considered. Consult the Usage, Peak Usage, and Detected columns to determine entitlement consumption under other metrics.
- Concurrent: the consumed count is the peak concurrent usage over the time range of the report (see the “Peak Usage” column), capped at the combined policy limit if all policies are hard-limit (i.e. not set to Enforcement: None)
- Lease: the consumed count is the peak allocation of all Lease policies over the time range of the report
- Node: the consumed count is the total number of installs determined by a Product audit, less those installs that can be attributed to policies with other metrics
- User Lease: the consumed count is the peak allocation of all Lease policies over the time range of the report
- User: the consumed count is the total number of Users listed in the combines Licensed Users lists of all policies configured for this metric
- Adjustment: some usage metrics have an alternative measure of entitlement consumption. This column shows how much the Consumed column could be adjusted by using the alternative measure.
- Floating: the adjustment count is the concurrent usage that exceeds the limits set in policies. For hard-limit Floating policies this alternative measure might be higher than the Consumed count if the policy limit was reduced at some point during the time range of the report.
- Node: the adjustment count is the number of installed copies of a product that have not been used during the time range of the report.
- Additional: the additional liability or overspend implied by the Adjustment column
- Usage: for Concurrent or Site licenses, the peak Concurrent usage of this license. For Lease licenses, the peak number of allocations. For other license types, the number of computers who have used a license.
- Peak Usage: the peak Concurrent usage of this license (regardless of Metric).
- Detected: the number of Computers that have something to do with this Product/Metric — where it has been used, audited, etc.
- Audit Only: the number of Computers showing this product in an audit, but not using it
- Not Locked: the number of Computers that have this product in an audit, and have used the product, but are not currently associated with a Policy.
- Locked Only: the number of computers that are consuming a node lock entitlement but don't have the software installed and have not used it.
- Solid: the number of computers that clearly need an entitlement for this product.
- Total Cost: the total cost of all relevant purchase.
- Estimated Cost: when some purchases have a cost and others have no cost, the known cost is used to extrapolate an estimate for the total number of entitlements. Generally all purchases should have a cost, so this column will match the Total cost.
- Unit Cost: the average cost per entitlement, based on all original purchases that have a cost value.
- Upgrade Cost: the average cost per entitlement, based on all upgrade purchases that have a cost value.
- Unique Users: The number of unique users who have used a product.
- Audited: The number of Computers showing this product in an audit, whether or not it has been used
Compliance (PROD x comp)
This report has two unique columns:
- Reason: The reason this computer is displayed for this product
- Witness: The product or policy that is relevant to this computer
Depreciation (PRCH)
The Depreciation (PRCH) uses Purchase records and standard depreciation models to report on depreciation of assets. There are a number of different parameters to how the financials are calculated - these can be found in the “Options” pane of the Report Builder window.
Install Codes
These are 3 tier reports that will show either by Purchase or Product, all Codes and Computer/User assignments. Once run you can change the view to alter the nesting as desired. While the reports say "comp", they will show computer or user assignments. The Limit and Assigned columns show counts and totals to easily see available seats. These leverage the Install Codes used in Purchase records which can also be seen from the Computer and User detail windows.
Purchases
Purchases (PROD x prch) is very similar to Config (PROD x prch). However, the Config report is merely listing purchases for a product, while the Purchases report is more suited for reporting on purchasing. It has some additional optional columns, and it can accept a time range will limit the report to just the purchases made during that time range. Purchases (PUBL x prch) groups by publisher instead of by individual product.
Summarize reports
These reports give an overall summary of configuration and usage statistics. Unlike the Usage reports, they do not show information about where policies and programs were used, but they do give overall summaries like peak Concurrent Usage.
- The first line of Summarize (PLCY) says “KeyServer” and will show you a summary of “KeyServer usage” — users logging on to the KeyServer, and logging off again.
- The “Name” column shows the name of the product, program, policy, division, or user.
- The “Variant” column is only shown in Summarize (PRGM) and shows the version of the program variant.
- The “Version” column is only shown in Summarize (PROD) and shows the version of the product.
- The “Type” column shows the type of the program or policy.
- Summarize (PLCY) has a “Limit” column which shows the policy limit.
- The “In Use” column shows how many copies are in use as of the end of the time range used for the report. If you selected a time range ending “now”, this value in Summarize (PLCY) should match what you can see in the Policies window.
- Summarize (PRGM) has a “Deny” column which shows how many times a program launch was denied.
- The “Peak” column shows the peak number of copies that were in use at any particular time (i.e. the maximum Concurrent usage).
- The “Total” column shows the Total number of launch / policy checkout events for the product / program / policy.
- The “Total Time” column shows the total amount of time (hours:minutes) of use. If copies are still in use, this reflects usage up until the end of the time range for the report.
- Summarize (PLCY) has four additional columns which show the current length of the waiting queue for the policy, the maximum length of the queue, the total time spent on the queue, and the average time spent on the queue.
Usage reports
These reports all summarize usage information for policies, products, or programs (actually “program variants”). Each report pair presents the same information but with the summary and detail fields interchanged.
The division reports (DIV or div) aggregate together information from all the computers within each division.
The pool reports allude to the schedules which can be set up in a custom policy in order to enforce group membership requirements that restrict access to each scheduled pool. Pool reports show which group requirement allowed the usage of a policy, product, or program, either through a pool in a custom policy, or through a group scope for a policy. Any usage which did not require group membership shows up as “universal”. If you have not set up groups, group scopes on policies, or custom policies with multiple pools, these “pool” reports will not be very interesting since ALL usage would be detailed with a single line: “universal”.
- The “Name” column shows the name of the computer, division, folder, policy, pool, product, program, or user.
- The “Variant” column only appears in reports that show program usage, and contains the significant digits of the program variant (with the keyed symbol, if appropriate).
- The “Version” column only appears in reports that show product usage, and contains the version of the product.
- The “Type” column shows the type of a computer, program, or policy. It is blank for divisions, folders, pools, products, and users.
- The “% Usage” column is only available in Usage reports where the primary group is a policy, product, or program. It shows what percent of the total usage time was contributed by each detail line. This could be useful for bill back.
- The “Utilization Score” column is only available in Usage reports where computer and either policy or program are the targets. It expresses the percentage of time the program or product was used as a ratio of the total time of the report range. Where multiple computers are concerned, this is an average of the individual utilizations for the summary line of the program or product.
- The “Total Time” column shows the total usage time (hours:minutes). For a summary line, it is the total usage over all its detail lines. For a detail line, it is the total usage for that particular line.
- The “Total Count” column shows the number of usage events for each line. For a summary line, it is the sum of the counts for all the detail lines that appear below its expansion icon.
- The “Avg Time” column shows the average usage time per week (hours:minutes). If the report is on less than half a week, this field shows “N/A”, since an average would be misleading.
- The “Avg Count” column shows the average number of uses per week. If the report is on less than half a week, this field shows “N/A”, since an average would be misleading.
- The “Last Used” column shows the last quit time for a product or program, or the policy return time for a policy within the time range of the report. This field will not reflect currently active usage of a program (or product or policy) that has been launched but has not yet quit.