Dashboard Widgets
Admin Alerts
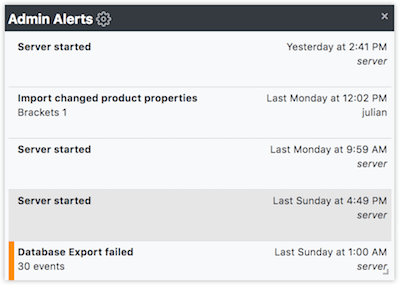
Recent alerts and warnings.
This widget shows a list of recent admin alerts generated by KeyServer indicating notable events and conditions that might need to be addressed.
View: list
Embed ID: JournalAlerts
App Extra
Quick Access to an app extra.
In order to use this widget you must first install some app extras.
View: banner
Embed ID: AppExtra
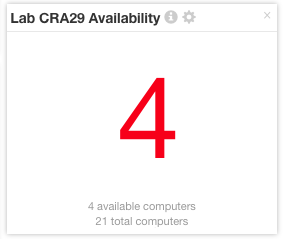
Availability
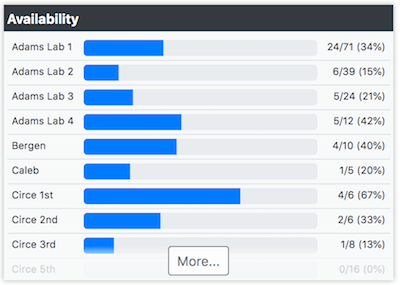
Computer availability across computer divisions.
For each division this widget shows the number of computers available (where no one is currently logged in), and the total number of computers in the division. Clicking each division takes you to a map page. When you are logged in to KeyReporter with appropriate permissions, you can configure the map for each division by dragging each computer to the appropriate spot and configuring 'static' objects like rectangles and circles. The widget can be configured to show all divisions, or only those divisions where a map has been defined.
View: list
Embed ID: Availability
Availability Map
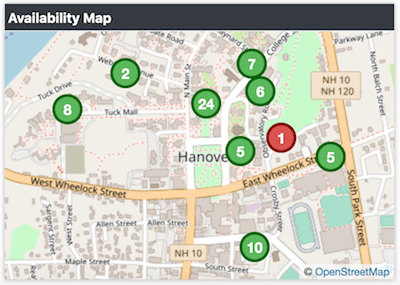
Display an availability map.
Display an availability map.
View: banner
Embed ID: FloorPlan
Camera Property
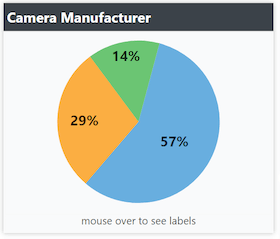
Chart of cameras grouped by a device property.
This widget lets you configure which camera property you are interested in, and then constructs a pie chart or bar chart of cameras showing distribution of values for that camera property.
View: piechart
Embed ID: CameraProperty
Capacity
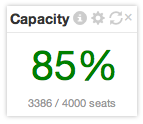
Percentage of KeyServer seats that have been allocated to computers.
A live view of the percentage of KeyServer seats that have been allocated to computers. This lets you keep an eye on whether you need to upgrade your KeyServer license to support more seats.
View: value
Embed ID: Capacity
Compare Recent Utilization
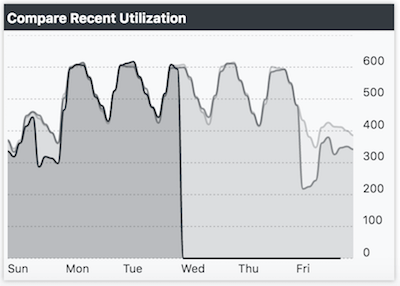
Computer utilization over a specified time range.
This widget shows a graph of computer logins within a specified Section over a configurable time range.
View: graph
Embed ID: LoginsTimeComparison
Compare Utilization
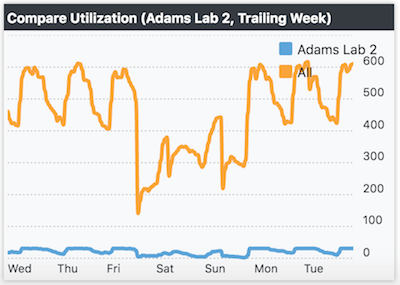
Computer utilization over a specified time range.
This widget shows a graph of computer logins within a specified Section over a configurable time range.
View: graph
Embed ID: LoginsScopeComparison
Compliance Position
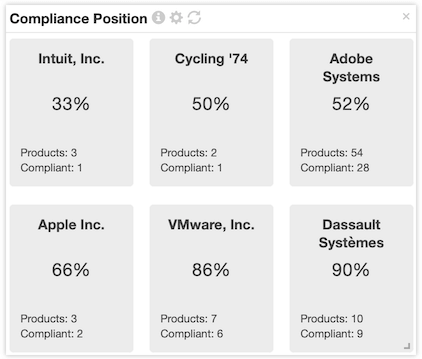
Estimated cost of under-purchased entitlements.
Purchase records are compared to software that is installed (for Node Lock licenses) or being used (other license types). Publishers are listed for products where not enough entitlements were purchased.
View: cards
Embed ID: EstimatedNoncompliance
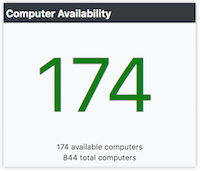
Computer Availability

Real time number showing available computers within a certain scope.
Similar to the Availability widget, this gives a real time view of how many computers within a certain scope have someone logged in.
View: value
Embed ID: ScopeAvail
Computer Count
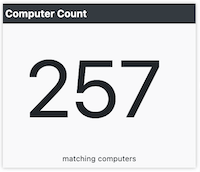
Real time number showing the computers within a certain scope.
This widget gives a simple count of how many computers are within a certain scope, optionally filtered by login type.
View: value
Embed ID: ScopeCount
Computer Form Factor
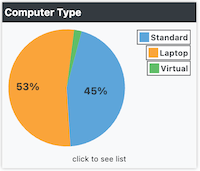
Breakdown of computers by Desktop, Laptop, Virtual, Thin Client, Mobile, etc.
A piechart is constructed grouping computers into several categories -- Desktop, Laptop, Virtual, Thin Client, Mobile, etc.
View: piechart
Embed ID: TopMachType
Computer Property
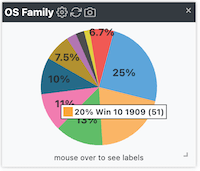
Chart of client computers grouped by a hardware property.
This widget lets you configure which hardware property you are interested in, and then constructs a pie chart or bar chart of computers showing distribution of values for that hardware property.
View: piechart
Embed ID: HardwareProperty
Computer Utilization
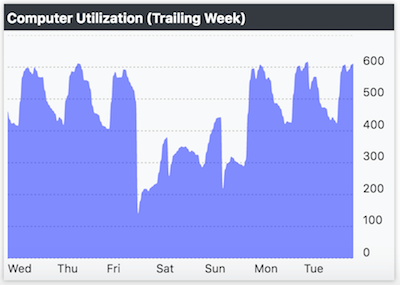
Computer utilization over a specified time range.
This widget shows a graph of computer logins within a specified Section over a configurable time range.
View: graph
Embed ID: LoginHistory
Computers by Last Login
Deprecated — use Computers by Last Login Range instead
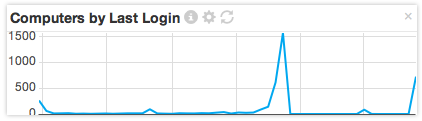
Graph showing computers that last logged in during different weeks over the past year.
For each week leading up to today, the number of computers that last logged in during that week is charted. Usually, the biggest bump on this graph will occur at the far right. As the last logon gets older and older, there should be fewer and fewer computers counted.
View: graph
Embed ID: LastLoginChart
Computers by Last Login Range
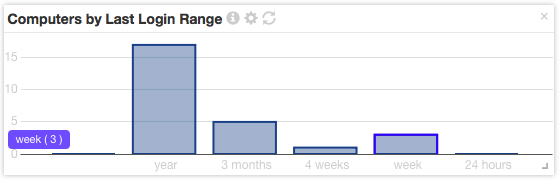
Bar graph showing computers that last logged in during different date ranges relative to today.
This report shows how many computers have logged in during the last year, 3 months, etc.
View: graph
Embed ID: LastLoginBar
Computers by Lease End Date Range
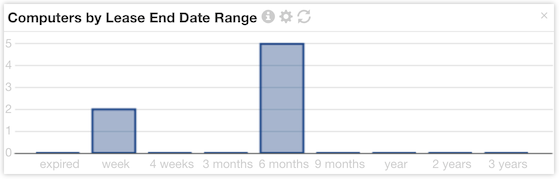
Bar graph showing computers with equipment leases expiring during different date ranges relative to today.
This report shows how many computers have equipment leases that will expire in the coming month, year, etc.
View: graph
Embed ID: LeaseDateBar
Computers by Loan Due Date Range
Bar graph showing computers on loan with due dates during different date ranges relative to today.
This report shows how many computers on loan that are due for return in the coming month, year, etc.
View: graph
Embed ID: LoanDateBar
Computers by Purchase Date Range
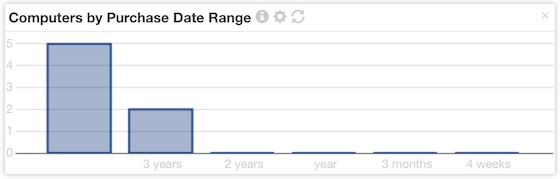
Bar graph showing computers purchased during different date ranges relative to today.
This report shows how many computers were purchased during the last 3 months, year, etc.
View: graph
Embed ID: PurchaseDateBar
Computers by Replacement Date Range
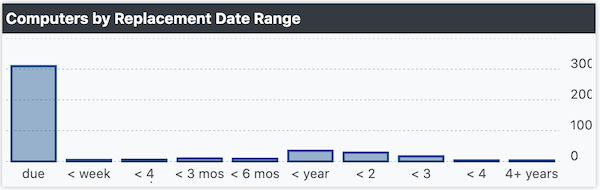
Bar graph showing computers with replacement dates during different date ranges relative to today.
This report shows how many computers have replacement dates that will expire in the coming month, year, etc.
View: graph
Embed ID: ReplaceDateBar
Computers by Warranty Date Range
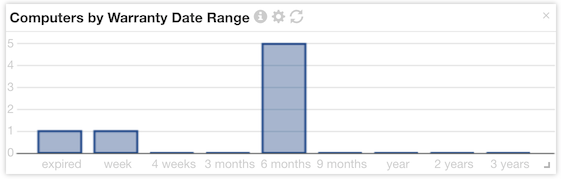
Bar graph showing computers with warranties expiring during different date ranges relative to today.
This report shows how many computers have warranties that will expire in the coming month, year, etc.
View: graph
Embed ID: WarrantyDateBar
Create Computer

Create Computer with a form.
This widget gives you a quick way to create a Computer and edit it in a custom Form.
View: create
Embed ID: CreateComputerWithForm
Create Device

Create Device with a form.
This widget gives you a quick way to create a Device and edit it in a custom Form.
View: create
Embed ID: CreateDeviceWithForm
Create Purchase

Create Purchase with a form.
This widget gives you a quick way to create a Purchase and edit it in a custom Form.
View: create
Embed ID: CreatePurchaseWithForm
Current Utilization
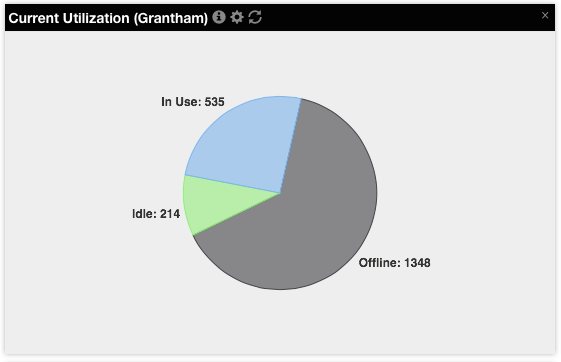
Current utilization of computers.
This chart shows the current utilization of computers within a section or for all sections. Computers are divided into four categories: In Use (logged in to the server), Idle (logged in with no recent user activity), Logged Out (powered on but not logged in), and Offline. Note that clients older than 7.4 will only be counted in the In Use or Offline categories.
View: piechart
Embed ID: LoginsCurrent
Custom Banner
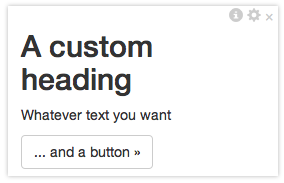
A simple button to link anywhere.
This widget gives you a way to link to any page addressable by a URL, with whatever Heading and Text you specify. The link can be internal to KeyReporter, or it can be any external link.
View: banner
Embed ID: CustomBanner
Denied Programs
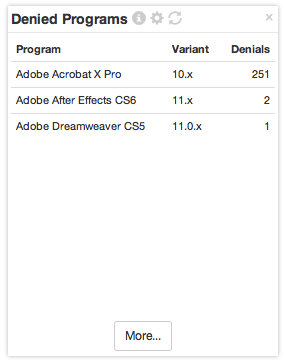
Summary of program denials within a time range.
Each program that has been denied launch is listed, along with a count of denials. Programs must have a policy in order for launch to be denied. There could be an explicit Deny policy, or there could have been a Deny because for example a Concurrent Manage policy was at its limit.
View: list
Embed ID: ProgramDenials
Devices by Lease End Date Range
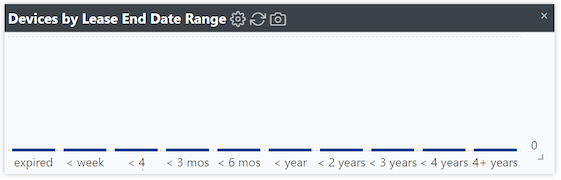
Bar graph showing devices with equipment leases expiring during different date ranges relative to today.
This report shows how many devices have equipment leases that will expire in the coming month, year, etc.
View: graph
Embed ID: DeviceLeaseDateBar
Devices by Loan Due Date Range
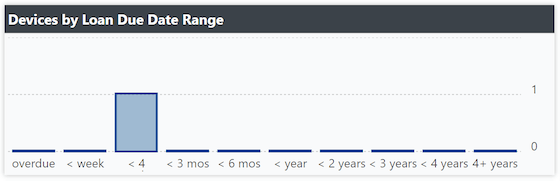
Bar graph showing devices on loan with due dates during different date ranges relative to today.
This report shows how many devices on loan that are due for return in the coming month, year, etc.
View: graph
Embed ID: DeviceLoanDateBar
Devices by Purchase Date Range
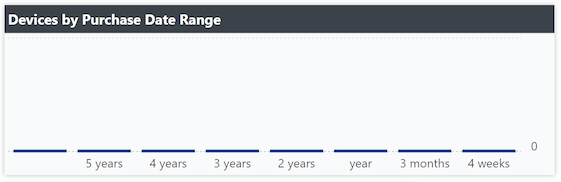
Bar graph showing devices purchased during different date ranges relative to today.
This report shows how many devices were purchased during the last 3 months, year, etc.
View: graph
Embed ID: DevicePurchaseDateBar
Devices by Replacement Date Range
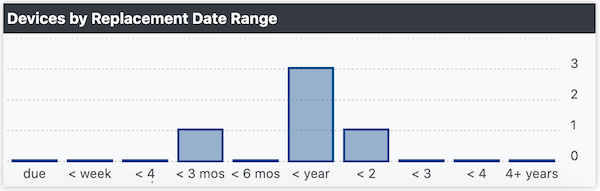
Bar graph showing devices with replacement dates during different date ranges relative to today.
This report shows how many devices have replacement dates that will expire in the coming month, year, etc.
View: graph
Embed ID: DeviceReplaceDateBar
Devices by Warranty Date Range
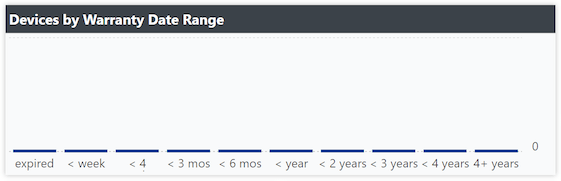
Bar graph showing devices with warranties expiring during different date ranges relative to today.
This report shows how many devices have warranties that will expire in the coming month, year, etc.
View: graph
Embed ID: DeviceWarrantyDateBar
Disk Free
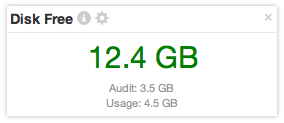
Free disk space on KeyServer computer.
If free disk space on the KeyServer computer is exhausted, KeyServer will be unable to write to its databases, and KeyReporter will be unable to run new reports.
View: value
Embed ID: DiskFree
Display Property
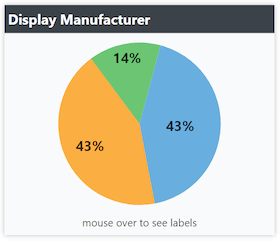
Chart of displays grouped by a device property.
This widget lets you configure which display property you are interested in, and then constructs a pie chart or bar chart of displays showing distribution of values for that display property.
View: piechart
Embed ID: DisplayProperty
Division Availability
Deprecated — use Computer Availability instead
Real time number showing available computers within a single division.
Similar to the Availability widget, this gives a real time view of how many computers within the specified division have someone logged in. This widget shows one division at a time, but you can add copies of the widget that each show a different division.
View: value
Embed ID: DivAvail
Division Logins
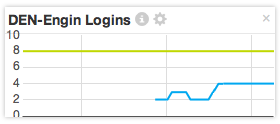
Real time usage chart of logins within a single division.
Similar to the Availability widget, this gives a real time view of how many computers within the specified division have someone logged in. This widget shows one division at a time, but you can add copies of the widget that each show a different division.
View: graph
Embed ID: DivLogins
Estimated Liability
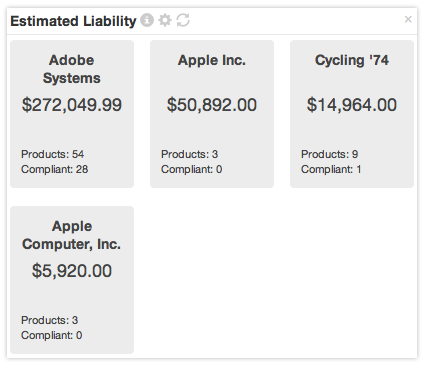
Estimated cost of under-purchased entitlements.
Purchase records are compared to software that is installed (for Node Lock licenses) or being used (other license types). For products where not enough entitlements were purchased, the purchase price is used to extrapolate an Estimated Liability amount.
View: cards
Embed ID: EstimatedLiability
Estimated Overspend
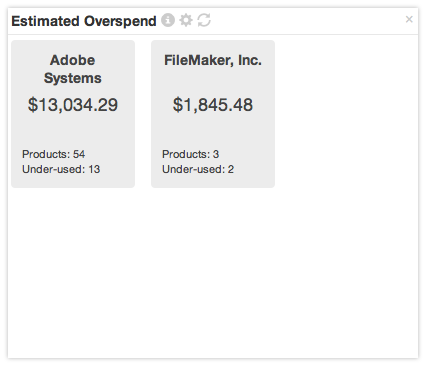
Possibly over-purchased entitlements.
Purchase records are compared to software actually being used. For products where more entitlements were purchased than are needed, the purchase price is used to extrapolate a possible overspend amount.
View: cards
Embed ID: EstimatedOverspend
Estimated Residual Value
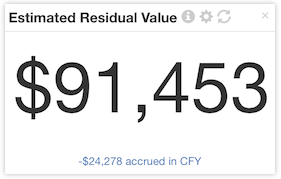
Estimated Residual Value of Purchased Assets.
The residual value of software and hardware assets where purchasing information is known.
View: value
Embed ID: EstimatedResidualValue
Expiring Policies
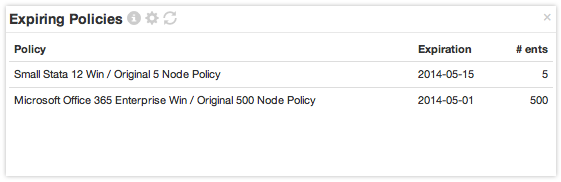
Policies that will be expiring soon.
Some policies are perpetual, while others have an expiration date to match the entitlement that was purchased. This widget lists policies that expire in the near future.
View: list
Embed ID: ExpiringPolicies
Expiring Purchases
Purchases that will be expiring soon.
Some purchases are perpetual, while others have an expiration date. Expiring purchases are listed in order of their expiration.
View: list
Embed ID: ExpiringPurchases
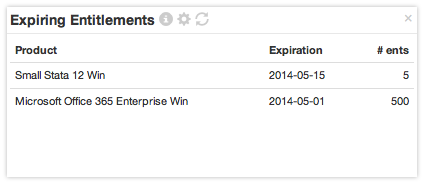
Expiring Software Entitlements

Entitlements that will be expiring soon.
Some entitlements are perpetual, while others have an expiration date. Expiring entitlements are listed in order of their expiration.
View: list
Embed ID: ExpiringEntitlements
Export Status
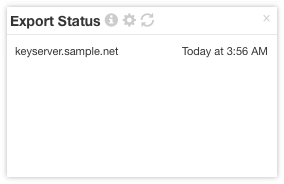
Status of data export.
This widget shows the status of exports to an external data source. If the export is in progress, the current table will be shown. Otherwise 'idle' or the last export time will be shown.
View: list
Embed ID: ExportStatus
Find Computer
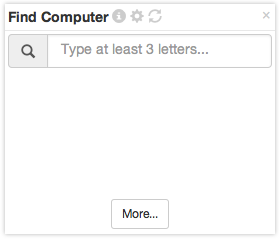
Find a computer by name.
This widget gives you a quick way to search for a Computer and display it on the inspector page. From the inspector page you can run reports on that computer, or open the corresponding computer details in KeyConfigure in order to do configuration.
View: search
Embed ID: ComputerSearch
Find Device
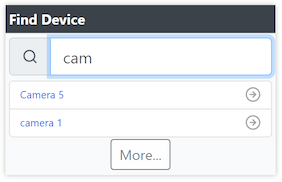
Find a device by name.
This widget gives you a quick way to search for a Device and display it on the inspector page. From the inspector page you can run reports on that device, or open the corresponding device details in KeyConfigure in order to do configuration.
View: search
Embed ID: DeviceSearch
Find Policy
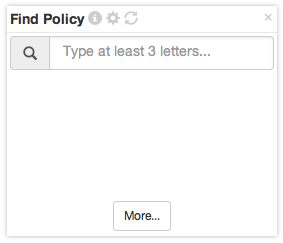
Find a policy by name.
This widget gives you a quick way to search for a Policy and display it on the inspector page. From the inspector page you can run reports on that policy, or open the corresponding policy details in KeyConfigure in order to do configuration.
View: search
Embed ID: PolicySearch
Find Product
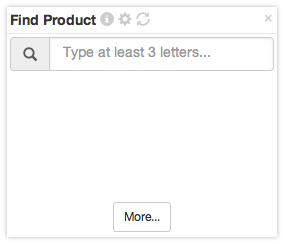
Find a product by name.
This widget gives you a quick way to search for a Product and display it on the inspector page. From the inspector page you can run reports on that product, or open the corresponding product details in KeyConfigure in order to do configuration.
View: search
Embed ID: ProductSearch
Find Purchase
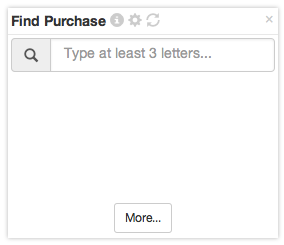
Find a purchase by name.
This widget gives you a quick way to search for a Purchase and display it on the inspector page. From the inspector page you can run reports on that purchase, or open the corresponding purchase details in KeyConfigure in order to do configuration.
View: search
Embed ID: PurchaseSearch
Find User
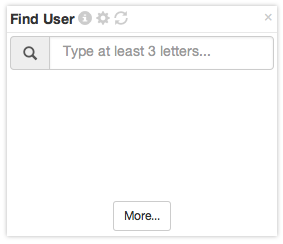
Find a user by name.
This widget gives you a quick way to search for a User and display it on the inspector page. From the inspector page you can run reports on that user, or open the corresponding user details in KeyConfigure in order to do configuration.
View: search
Embed ID: UserSearch
Hardware Salvage Value
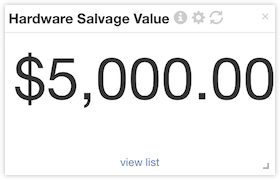
Salvage Value of Hardware Assets.
The salvage value of hardware assets where purchasing information is known, and the asset Lifecycle stage is not Missing, Disposed, or Salvaged.
View: value
Embed ID: SalvageValue
Highest purchase price
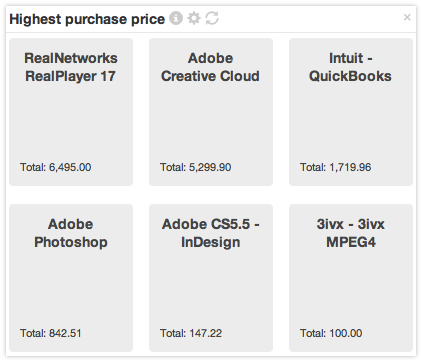
Products by highest cost spent.
This widget uses Purchase records to calculate which Products you have spent the most on.
View: cards
Embed ID: PurchasesProduct
Highest purchased publishers
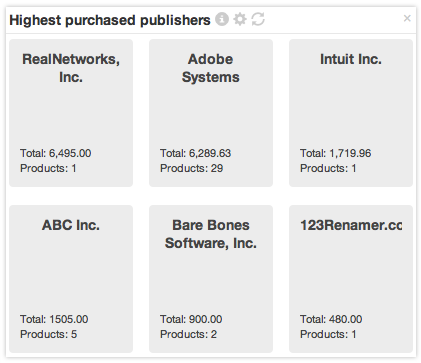
Product publishers by highest cost spent.
This widget uses Purchase records to calculate which Publishers you have spent the most on.
View: cards
Embed ID: PurchasesPublisher
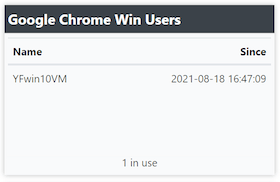
KeyConfigure Windows
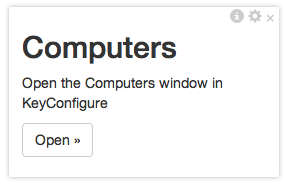
Open KeyConfigure main windows.
Each instance of this widget can be configured to open one of five different main windows in KeyConfigure: Computers, Policies, Products, Programs, Purchases.
View: banner
Embed ID: KeyConfigureWindow
Map Availability
Deprecated — use Computer Availability instead
Real time number showing available computers at a single map location.
Similar to the Availability widget, this gives a real time view of how many computers at the specified location have someone logged in. This widget shows one location at a time, but you can add copies of the widget that each show a different location.
View: value
Embed ID: MapAvail
Most Used Computers
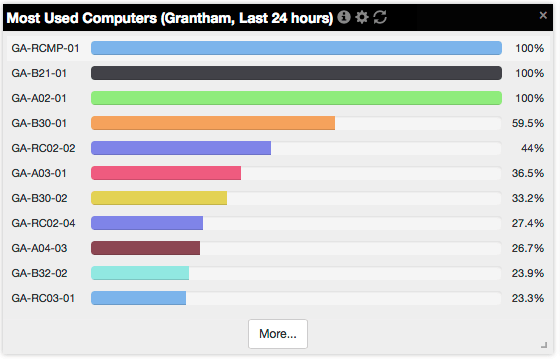
Computer utilization over a specified time range.
This widget lists the computers within a specified Section that have been used the most over a configurable time range.
View: list
Embed ID: TopComputers
Most Used Product Families
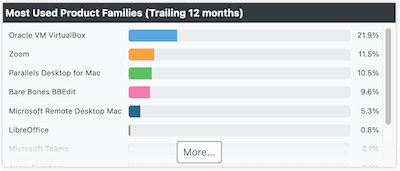
Product utilization over a specified time range.
This widget lists the product families that have been used the most by computers within a specified Section over a configurable time range.
View: list
Embed ID: TopFamilies
Most Used Products
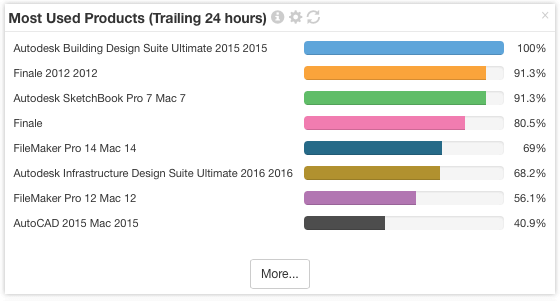
Product utilization over a specified time range.
This widget lists the products that have been used the most by computers within a specified Section over a configurable time range.
View: list
Embed ID: TopProducts
Most Used Programs
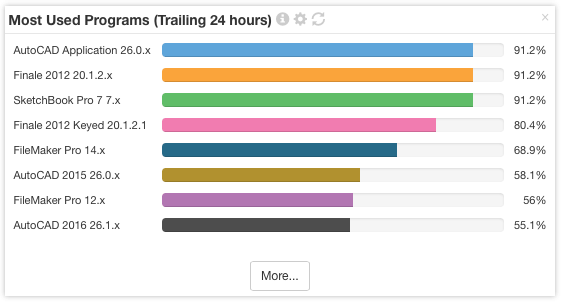
Program utilization over a specified time range.
This widget lists the programs that have been used the most by computers within a specified Section over a configurable time range.
View: list
Embed ID: TopPrograms
Network Device Property
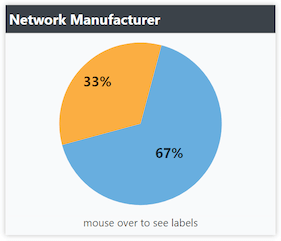
Chart of network devices grouped by a device property.
This widget lets you configure which network device property you are interested in, and then constructs a pie chart or bar chart of network devices showing distribution of values for that property.
View: piechart
Embed ID: NetworkProperty
One-click Report
Quick Access to a pre-configured report template.
In order to use this widget you must first save a report template by going to the Builder page and choosing 'Run On Demand' or 'Run On Schedule' and clicking Save. Then in the configuration for this widget, select the Template you want. Then the widget will allow you to quickly run a report using that template, or access the list of completed reports that have used the template.
View: banner
Embed ID: QuickReport
Other Device Property

Chart of other devices grouped by a device property.
This widget lets you configure which device property you are interested in, and then constructs a pie chart or bar chart of devices showing distribution of values for that property.
View: piechart
Embed ID: OtherProperty
Policies Near Limit
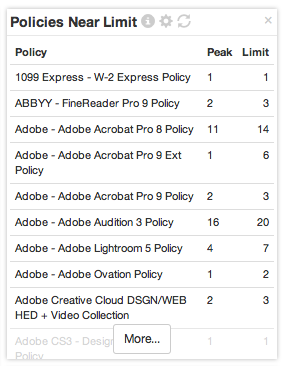
Policies for which allocations have come near the Licensed Limit.
You can configure the time frame and threshhold. The widget shows policies that went over the threshhold during the time frame.
View: list
Embed ID: PoliciesNearLimit
Policies Not Being Used
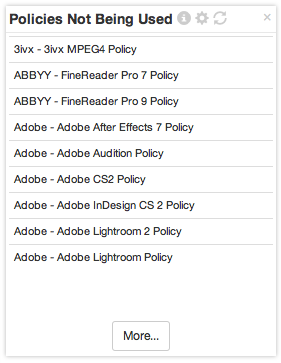
Policies that have not been used by any computers.
If a policy is not being used by any computers, this could point to a misconfiguration. More often though it is simply an old policy. Perhaps there is a newer version of the product.
View: list
Embed ID: PoliciesNotUsed
Policies Over Limit
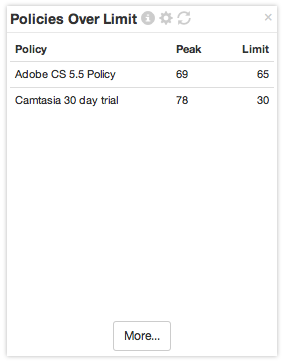
Policies for which allocations have gone over the Licensed Limit.
You can configure the time frame. The widget shows policies that went over the limit during the time frame. This can happen because of offline usage with the Relaxed Enforcement option, or online usage with Enforcement set to None
View: list
Embed ID: PoliciesOverLimit
Policies Underused
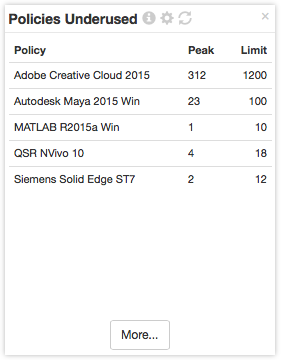
Policies for which allocations are low.
You can configure the time frame. The widget shows policies where allocations were below the configured threshold during the time frame.
View: list
Embed ID: PoliciesUnderused
Policy Top Users
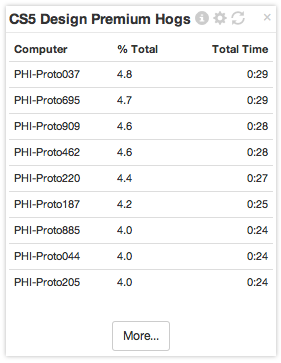
Top Users or Computers that use a Policy.
You must select a Manage or Observe Policy in the configuration for this widget. The widget will show a list of the users or computers that use the policy the most.
View: list
Embed ID: PolicyHogs
Policy Usage
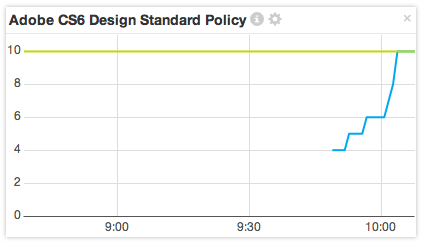
Real time usage chart of a single policy.
You must configure which policy you want to see usage for.
View: graph
Embed ID: PolicyInUse
Policy User Count
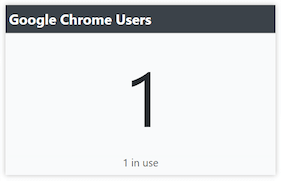
Real time number showing the number of users of a given policy.
You must select a Manage or Observe Policy in the configuration for this widget. The widget will show the count of licenses issued for the policy.
View: value
Embed ID: PolicyUserCount
Policy Users
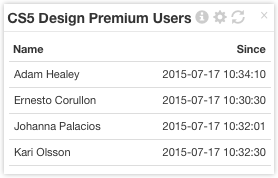
Current users of a policy.
You must select a Manage or Observe Policy in the configuration for this widget. The widget will show a list of the computers that have been issued a license on the policy.
View: list
Embed ID: PolicyUsers
Printer Property
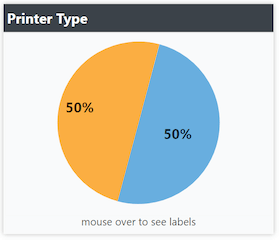
Chart of printers grouped by a device property.
This widget lets you configure which printer property you are interested in, and then constructs a pie chart or bar chart of printers showing distribution of values for that printer property.
View: piechart
Embed ID: PrinterProperty
Product Catalog
Deprecated
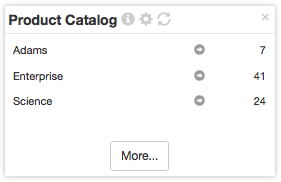
Products available for use.
Shows a catalog of products that are managed by KeyServer. This provides a place where users can see and potentially download available software.
View: list
Embed ID: ProductCatalog
Product Compliance
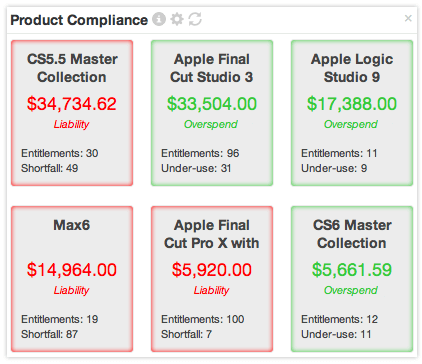
Compliance of product usage to purchased entitlements.
Purchase records are compared to audit and usage data to determine compliance. For Node Lock entitlements, numbers of installs are used to determine compliance. For Concurrent Use, peak concurrent Usage is used to determine compliance. Liability / Overspend estimates are displayed when Purchase records include price. Otherwise a question mark is displayed.
View: cards
Embed ID: ProductCompliance
Product Entitlements
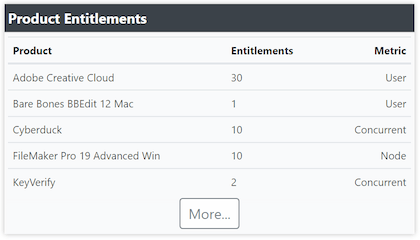
Roll-up of purchased entitlements for products.
All purchases for each product are combined to determine the total number of entitlements available for that product. Separate entitlement totals are shown for different metrics.
View: list
Embed ID: ProductEntitlements
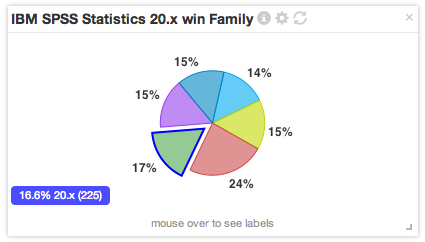
Product Installs in a Family

Pie chart of installs within a product family, split by major version.
Once you configure a specific product family as the reference, this widget shows a piechart of installs of all the different editions within that product family. This lets you track things like progress on a site wide upgrade.
View: piechart
Embed ID: ProductFamilyInstalls
Product Users
Current users of a product.
You must select a Managed or Observed Product in the configuration for this widget. The widget will show a list of the computers (or users) that are online and are running the product under a manage or observe policy.
View: list
Embed ID: ProductUsers
Products Not Being Used
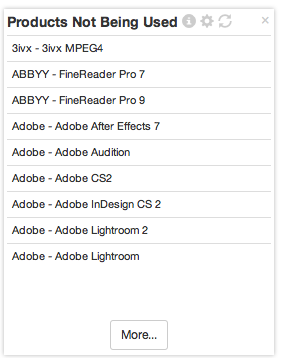
Referenced Products that have not been used during the specified interval.
The Products listed here have a Purchase and/or Policy in KeyServer, yet no usage of the products has been recorded during the specified time interval.
View: list
Embed ID: ProductsNotUsed
Program Installs in a Family
Pie chart of installs within a program family, split by major version.
Once you configure a specific program variant as the reference, this widget shows a piechart of installs of all the different versions within that program family. This lets you track things like progress on a site wide upgrade.
View: piechart
Embed ID: FamilyInstalls
Projector Property
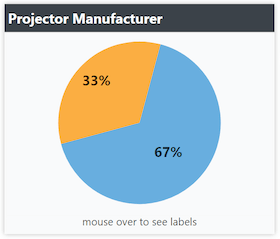
Chart of projectors grouped by a device property.
This widget lets you configure which projector property you are interested in, and then constructs a pie chart or bar chart of projectors showing distribution of values for that projector property.
View: piechart
Embed ID: ProjectorProperty
Queued
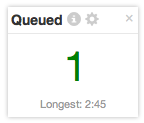
Number of policies currently queued.
When a concurrent use policy reaches its license limit, subsequent launches can be queued so that the user will be notified when a license becomes available. This widget shows the number of users queued for any policies.
View: value
Embed ID: QueueCount
Queued Policies
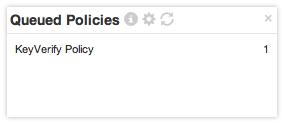
Policies that are currently queued.
When a concurrent use policy reaches its license limit, subsequent launches can be queued so that the user will be notified when a license becomes available. This widget shows a list of queued policies.
View: list
Embed ID: QueuedPolicies
Quick Link
Quick Access to a pre-configured report template.
In order to use this widget you must first save a report template by going to the Builder page and choosing 'Run On Demand' or 'Run On Schedule' and clicking Save. Then in the configuration for this widget, select the Template you want. Then the widget will allow you to quickly run a report using that template.
View: banner
Embed ID: QuickLink
Raw HTML
Display any legal HTML.
In the configuration for this widget you can enter any HTML, and it will be rendered inside the widget.
View: banner
Embed ID: RawHTML
Recent Logins
Deprecated
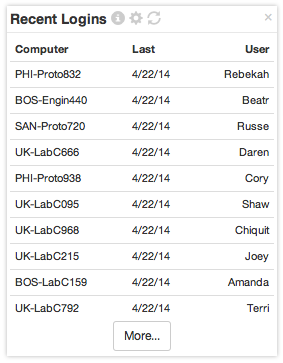
Recently logged in computers.
Shows a list of computers that have had a user logged in most recently. This might be most interesting for smaller KeyServers.
View: list
Embed ID: RecentLogins
Recent Products
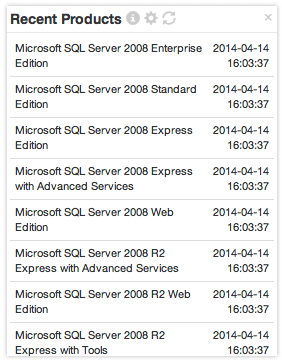
Products recently discovered by PRS.
PRS runs nightly and adds new Product definitions to your KeyServer any time new software is discovered at your site for which PRS has a product definition. This widget lets you keep an eye on what products have been added recently.
View: list
Embed ID: RecentProducts
Recent Programs
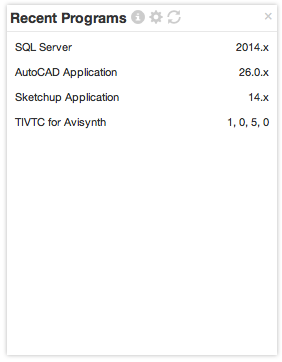
Programs recently discovered.
Shows a list of most recent program discoveries. Since many programs can be discovered every week, you may wish to look at this information in KeyConfigure, where you have room for a longer list.
View: list
Embed ID: RecentPrograms
Recent Reports
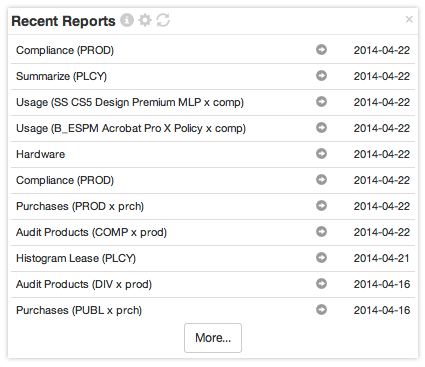
Recent completed reports.
This list shows reports that have completed recently. These same reports (and more) can be accessed from the Archive page.
View: list
Embed ID: RecentReports
Recently Installed Products
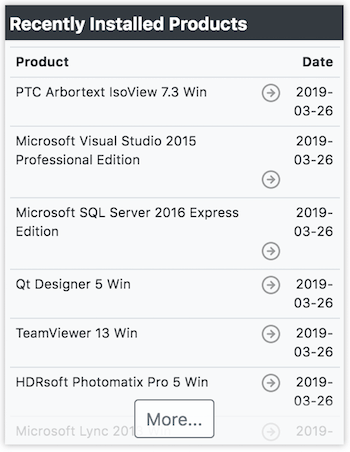
Products most recently installed on clients.
Shows Products sorted by the date they were first found in an audit. Gives a quick sense of what new products are available on computers.
View: list
Embed ID: RecentInstalledProducts
Report Archive
Deprecated
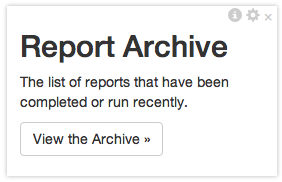
A simple button to go to the Archive page.
A link to the Archive page appears at the top of each KeyReporter page, so this widget merely provides an alternative UI for the same functionality.
View: banner
Embed ID: ArchiveBanner
Report Builder
Deprecated
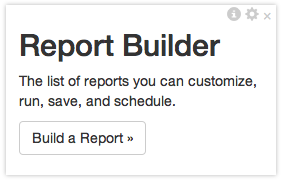
A simple button to go to the Builder page.
A link to the Builder page appears at the top of each KeyReporter page, so this widget merely provides an alternative UI for the same functionality.
View: banner
Embed ID: BuilderBanner
Report Folders
Deprecated
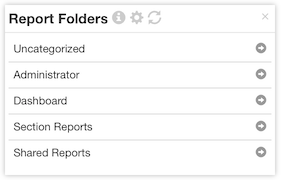
Report folder listing.
This list shows the accessible report folders. Clicking on a folder in the list opens the archive page listing the reports in the folder.
View: list
Embed ID: ReportFolders
Sassafras News

Read recent Sassafras News and Tech Blogs.
This widget uses RSS feeds from sassafras.com to display the latest news and tech articles directly in your KeyReporter dashboard.
View: list
Embed ID: SassafrasNews
Scanner Device Property

Chart of scanner devices grouped by a device property.
This widget lets you configure which scanner property you are interested in, and then constructs a pie chart or bar chart of scanners showing distribution of values for that property.
View: piechart
Embed ID: ScannerProperty
Server Load
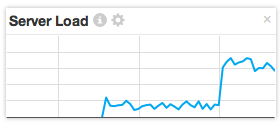
Client and general activity on the server.
This widget presents a live, auto-updating graph of server load. Note that it is hard to correlate the exact numbers with any specific activity - instead you should use this to get a general sense of relative load.
View: graph
Embed ID: ServerLoad
Software Availability
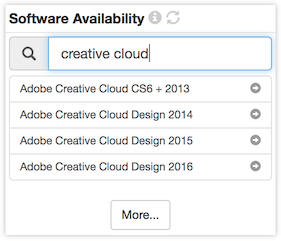
Find software by name, show where it can be used.
This widget gives you a quick way to search for a software product and display information on where it can be used.
View: search
Embed ID: SoftwareAvailability
Storage Device Property
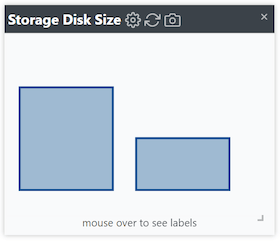
Chart of storage devices grouped by a device property.
This widget lets you configure which storage device property you are interested in, and then constructs a pie chart or bar chart of storage devices showing distribution of values for that property.
View: piechart
Embed ID: StorageProperty
Top Products
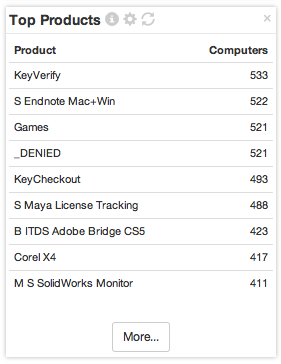
Top Products installed on clients.
Shows Products sorted by how many computers they are installed on. Gives a quick sense of what products are the most common.
View: list
Embed ID: TopInstalledProducts
Top Publishers (# of Products)
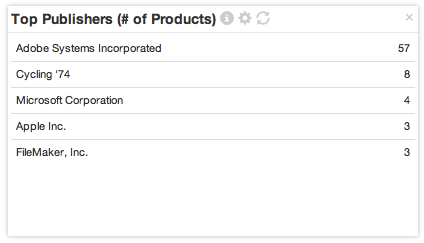
Top Publishers listed by number of different products purchased and/or managed.
Shows the Publishers for which you have the most Purchases and Policies.
View: list
Embed ID: TopPublishers
Unmanaged Products
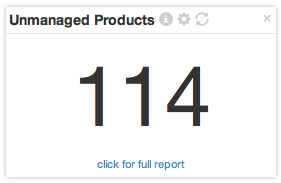
Number of products found in audits but unmanaged by KeyServer.
This number shows the number of different products found in audit data that do not have Policies defined. There are two ways to reduce this number. One is to take Unreferenced products and manually set them to Ignored in KeyConfigure. The other is to create Policies for the Unreferenced products. You can see the list of Products being counted by clicking in the widget.
View: value
Embed ID: UnmanagedProducts
Unused Node Locks
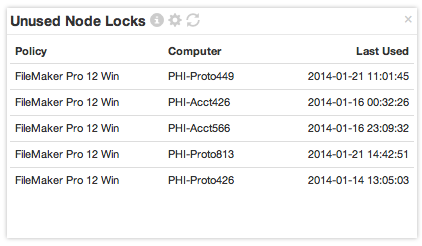
Policies locked to computers that have not been used recently.
A list of policy/computer pairs where a policy is locked but is not being used. In a well managed configuration, this might be a short list, which you can then actively maintain.
View: list
Embed ID: UnusedNodeLocks
Up Time
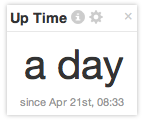
How long KeyServer has been running.
The amount of time KeyServer has been running since it was last started up.
View: value
Embed ID: UpTime
Upgraded Products
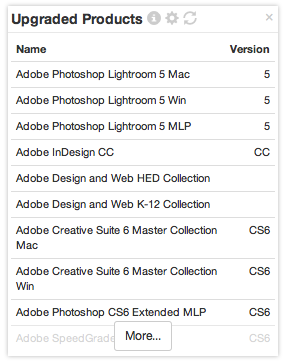
Products not currently referenced for which an earlier version is referenced.
If version 2 of a product has a policy but version 3 has no policy or purchase, version 3 will be listed in this widget. Usually this means that a new version is in fact installed at your site but you have not done configuration of that product yet.
View: list
Embed ID: UpgradeDiscoveriesProd
Upgraded Programs
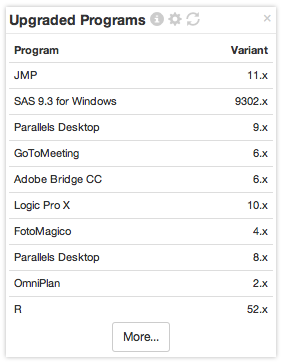
Programs not currently in any product even though an earlier version is.
If version 5 of a program has a product definition but version 6 has no product definition, this widget lists version 6. Usually this is a good indication that you need to create a new product definition.
View: list
Embed ID: UpgradeDiscoveries