Availability Maps

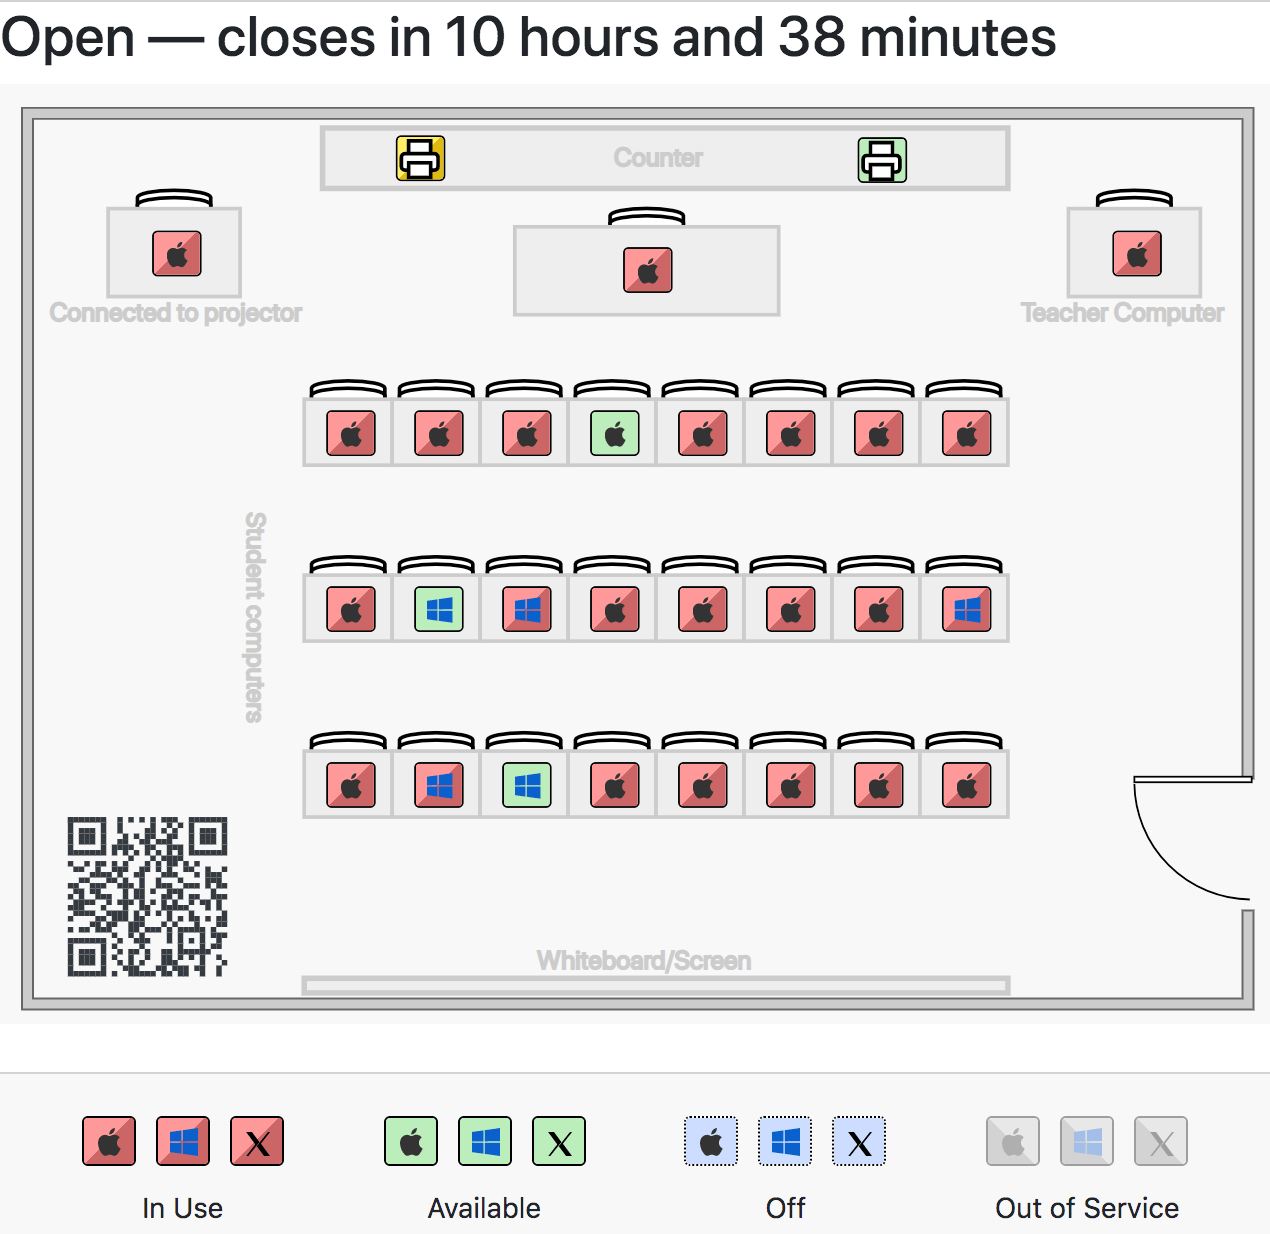
Maps in the Web UI can be quickly and easily configured to provide real time hardware and software availability information to lab users or show your fleet of systems on your building maps. These Maps can be Embedded on university branded web pages, and are fully responsive and accessible on phones and tablets. At a glance, students and faculty can see computer availability, operating system, lab hours, and a demand forecast that projects future availability based on historical usage trends. Clicking on a computer displays a list of installed software, and software availability throughout the lab is accessible from the search icon. IT staff on the other hand may find a map of the employee systems in the building with real time use information and the ability to pull up linked data useful for service needs.
See also our Tutorial Video on this topic.
Map Sets (Tabs)
Maps are accessible by both Guest and authenticated accounts from the Maps navigation item in the left hand side bar. There are Widgets that can be used to show Maps on the Dashboard (see notes below) but our primary focus here is on the Maps section of the Web UI.
The default view on the Maps screen will be a single tab (map set) with a list of Divisions in KeyServer that contain computers (empty divisions will not show), from which you can start building out Floorplans and create a street map. The term Map refers to one of the Tabs in this screen, which can contain multiple Floorplans (like a map of a given lab or floor of a building). Floorplans are discussed further below in detail and can be simple lists of computers.
You can add more map set Tabs to the Maps screen by clicking the + at the right of the last tab in the Ribbon. You can delete a tab by clicking its x. Click the gear ⚙ to configure the Properties of a map set. You can rename the original Map and change visibility settings, but you can not delete it.
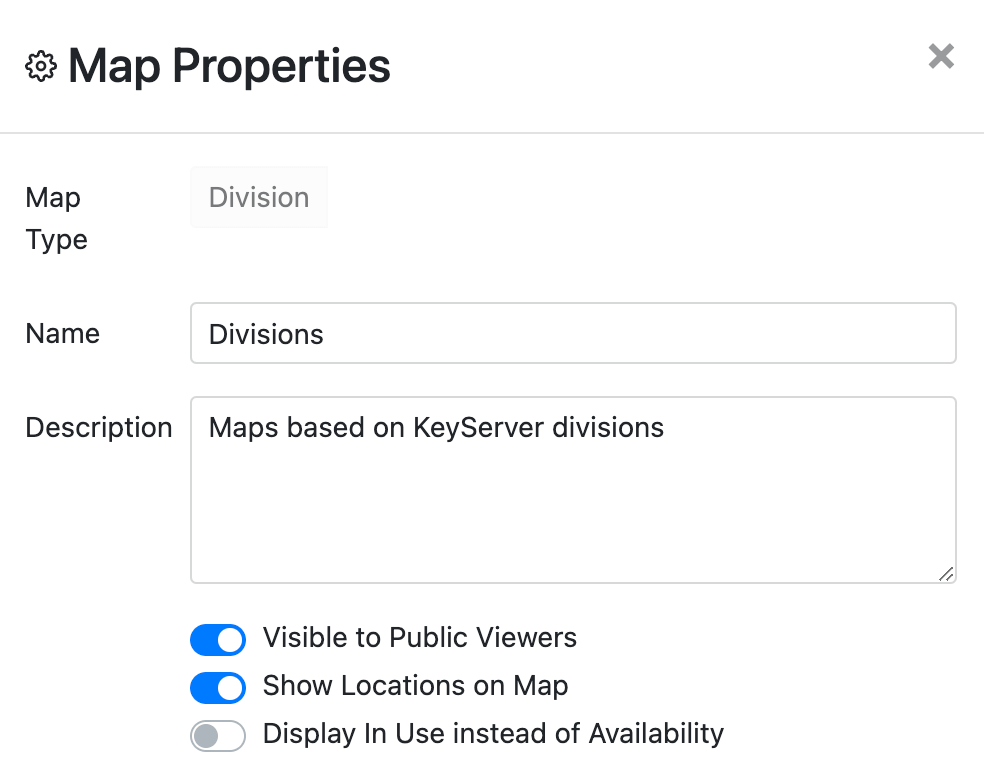
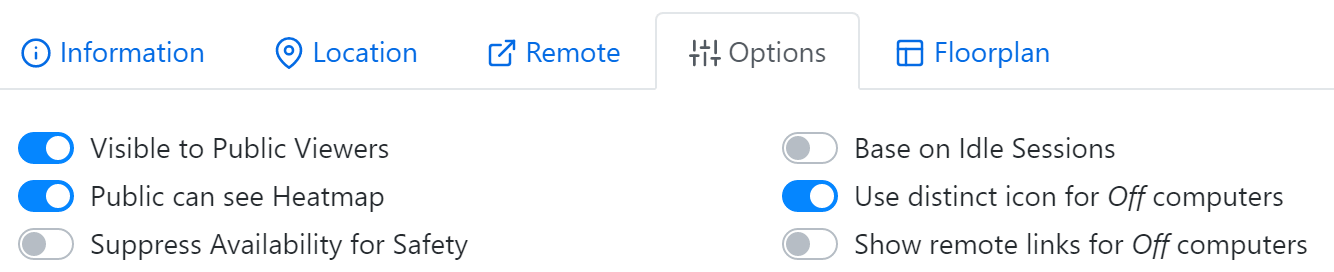
Note if a Map Set is not Visible to Public but Floorplans it contains are, you create "hidden" maps. A direct URL will allow someone to see these locations, but there will be no way to navigate to them in the Web UI. Show Locations on Map toggles if the street map view is shown on which you can pin the Floorplan locations. This means you can have pinned locations but instantly hide the street map if desired. Those map locations could still be seen in the Info tab of the Floorplans as well. Finally, Display In Use instead of Availability lets you show the percentage bars and numeric values on the pin dots based on active use instead of active availability.
When you make a new Map, you'll be prompted for the above settings, which includes the one time choice if it will be based on Division or Valued Tags. Using tags in KeyConfigure allows you to create a Floorplan that contains computers from different Divisions. This is more advanced, and typically Divisions suits everyday needs if your systems are logically grouped.
Tip: When making a Map based on Valued Tag, use only the portion of the tag name before the colon. This will cause all computers to be grouped by the portion after the colon, much like Divisions.
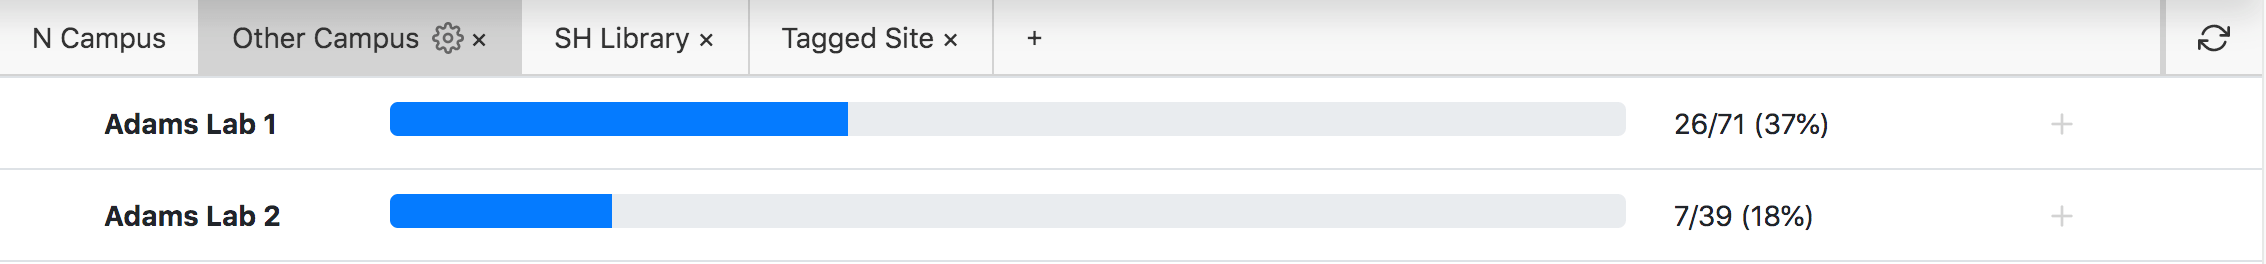
By default the maps only update when the refresh button in the upper right of the Ribbon is clicked, but from an administrative login to the Web UI, you can enable “auto-refresh mode” using shift-click on the refresh button (or by adding “auto=1” to the URL options). The green border around the refresh button then indicates that the map page will be updated every minute.
Note that you can create multiple tabs that are all based on Divisions, name each one differently, make different Floorplans on each Map, and the result for the public would be entirely different selections of labs. As an administrator you will see all the other divisions listed on a Map tab, but with no Floorplan made on that Map, it won't show up for the public.
List View and Pins
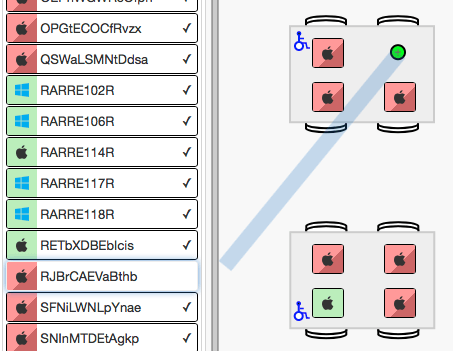
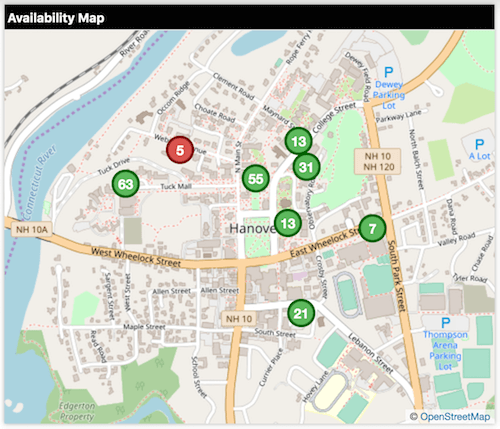
For each Division (or tag) the number of computers available (where no one is currently logged in), and the total number of computers in the division is displayed on the right, along with the percentage of in use machines. An Administrator can click on a Division to start the Floorplan creation process. Once a floorplan is created, clicking on a division row will then display the "lab map" and show which specific computers are available. If no floorplan has been created for a division, it will show a simple list of computers. Once a Floorplan is created, the division in the Map list will show a number of tools on the right side.
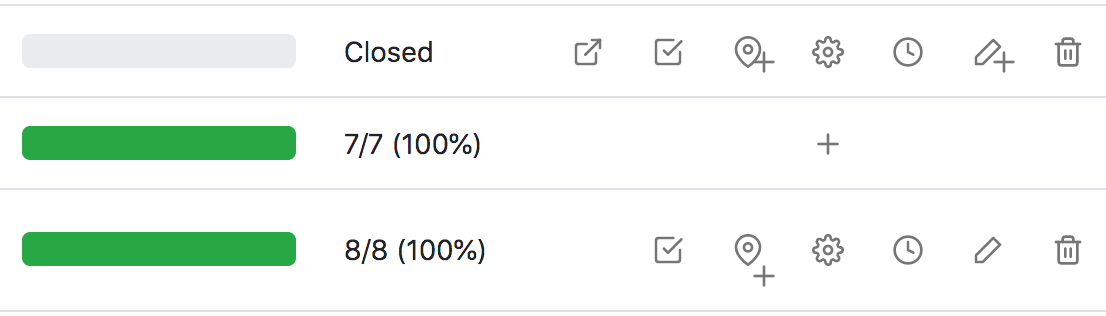
In the screenshot above, you can see some divisions have floorplans that are visible, others are hidden. Some are pinned on the map, some are not. One division has no floorplan created at all, so those other icons are not present. Two have started the process, but no actual floorplan was made so they will simply show as a list, while 3 others have full floorplans made. You can see these states can all exist in any combination, which allows for great flexibility in how you publish and display data for various divisions or tagged groups.
Floorplan Creation
Clicking the + on a division that has not yet had a floorplan made will bring up the Properties window to create a floorplan or "lab map". Note that simply adding a floorplan creates a list view, but creating the floorplan will take you to the editor to draw the location.
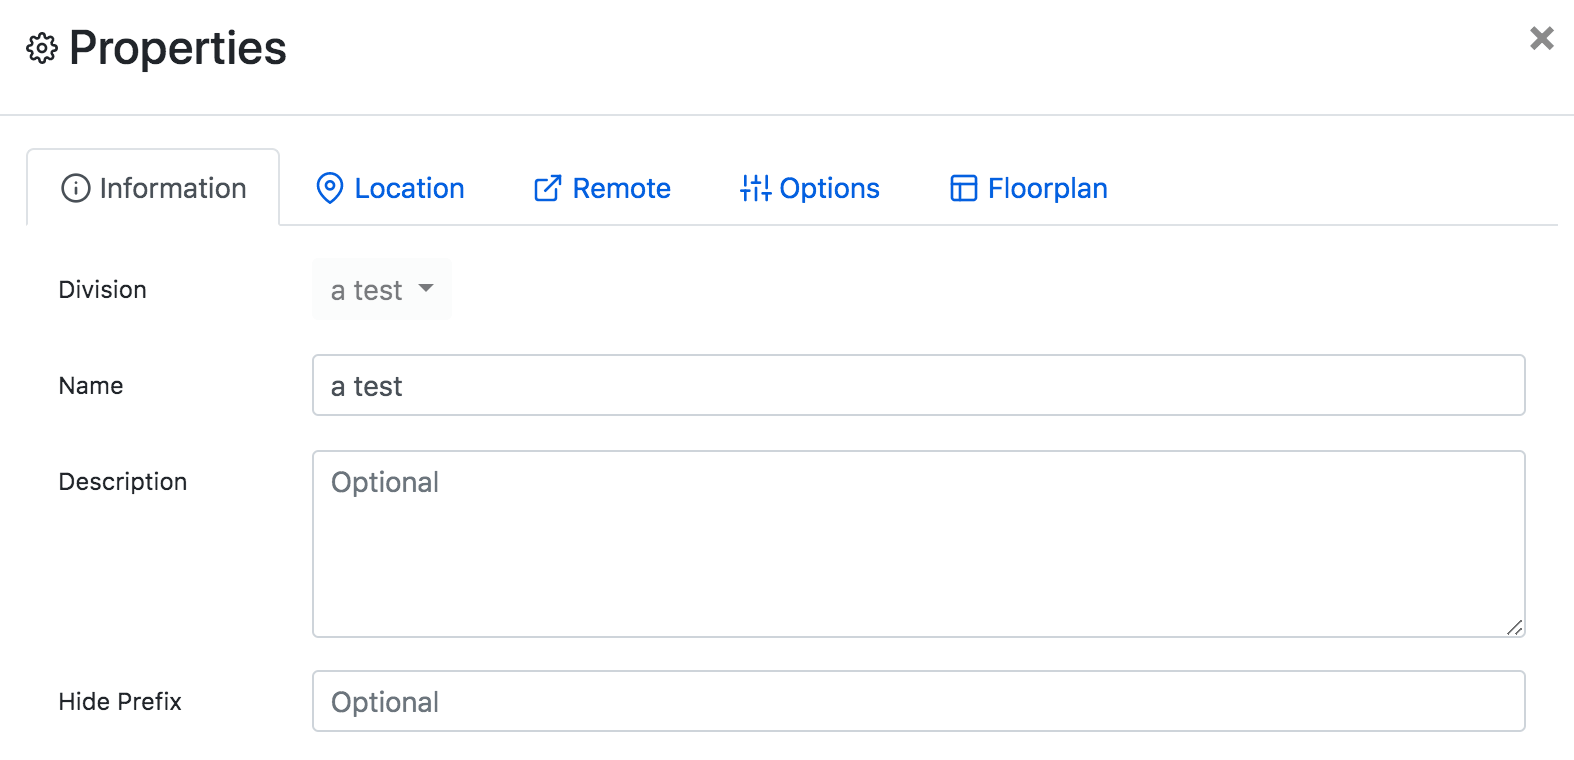
You can give the Floorplan any Name you like, and add a Description if desired. It is important to note that HTML can be used in the Description field to create advanced formatting and even link images from other web hosted locations. Note that you must use single quotes not double quotes in any markup like the img src, and you should limit the width of images to 300px so as to not exceed the bounds of the popup.
Depending on your computer naming convention, the Hide Prefix option may be useful to remove the beginning of system names from display for simplicity.
On the off chance you know the geographic Location, you can fill in the Lat and Lon coordinates on that tab, otherwise those will be added when you use the pin tool later to add the Floorplan to the street map view.
Remote Settings
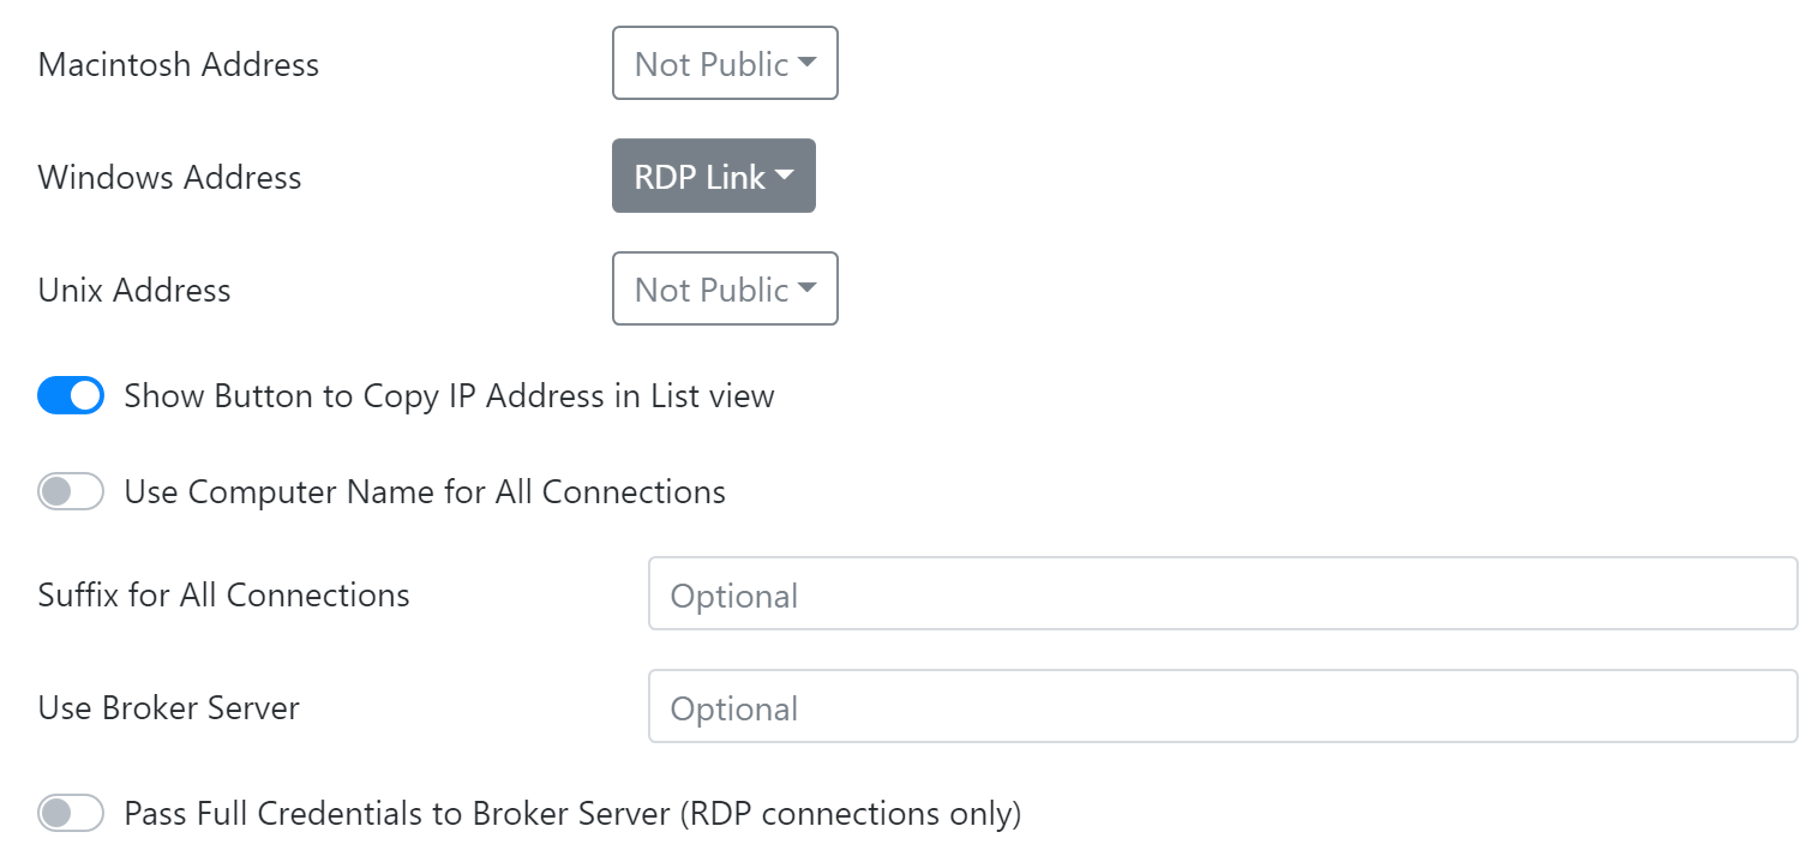
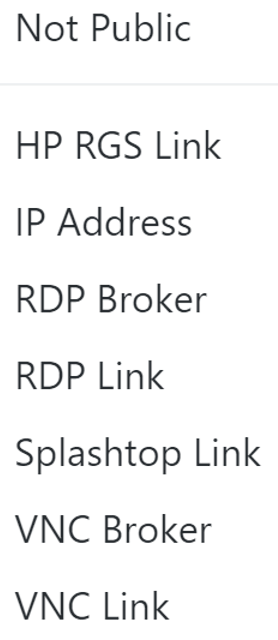
There is a great deal of granularity of control at the Floorplan and Computer level to customize your remote connectivity options. On a per platform basis on each floorplan you can choose what kind of connection you want to show, if any. Options include:
- Not Public - Show no link
- HP RGS - Download a customized HP RGS file to connect to the computer.
- Host Address - Show only a text IP/DNS address for the computer.
- NoMachine Link - Download a customized NoMachine file to connect to the computer.
- RDP Broker - Use a Guacamole server for a web based connection using RDP to the computer.
- RDP Link - Download a customized RDP file for the computer.
- Splashtop - Link through the Splashtop Business service to connect to the computer.
- VNC Broker - Use a Guacamole server for a web based connection using VNC to the computer.
- VNC Link - Connect using Screen Sharing from a Mac. This will do nothing on Windows as there is no native VNC handler.
Because there are solutions for offering RDP on Mac and Linux (e.g. xRDP) we offer the ability to choose what kind of link you show for every platform. These links show in a column in list view and as a link in the popup when clicking a computer in Floorplan view. When clicked, each type of Connect link will show information in a popup modal on how to proceed, with the exception of Broker connections which automatically hand off to Guacamole. If someone has already clicked a link but not yet connected, we put a 3 minute hold on the connection. This prevents someone trying to connect and being beaten by someone else.
Other options include:
- Copy Button - A button will be shown to the right of the Connect link that will copy the IP to the clipboard. This can be used for VNC on Windows to paste into a VNC viewer as the link will not automatically hand off.
- Use Computer Name - Instead of the IP, we'll use the computer name in the connection attempt. Generally this will be used with Suffix.
- Suffix - This is the DNS suffix to append to the computer name (starting with .) to create an FQDN connection by any chosen protocol. This does of course require properly configured DNS.
- Broker Server - The address for the Guacamole server if using Broker options.
- Pass Credentials - In the event you are using authenticated connections to the Sassafras Server Web UI, in a shared authentication environment with the target workstations, and using the RDP Broker, the end result can be clicking such a link connects to the machine and logs in the user with no further interaction at all.
Note that display of links is also dependent on the Scheduled Hours for the floorplan. This can include the use of an external group in the time period for Reservations. It is also dependent on any computer specific overrides for Map Availability. Also note the Auto-logout setting for computers to force logout on a disconnected remote session.
Note Authenticated users (with sufficient privilege and access) will see the IP of the system, but Guests will see the word Connect. This assumes the KeyReporter Guest account has the Remote Connection Role assigned. For more details on permissions see Accounts.
Note that we are not in any way relaying connections, you still need to consider Firewall and other security considerations for users to connect from their machine to the remote system.
It is possible to customize settings for RDP and RGS file downloads if needed (e.g. adding a Gateway setting). It is also possible to customize the information shown in the popup modal when you click the various connect links. For information on how to accomplish these things contact Sassafras Software Support.
Options
On the Floorplan tab you will see options based on if there is a floorplan created or not. If not, you can click Create to go to the Editor. If there is a floorplan you can Edit or Delete it from this tab. Avoiding this tab and simply clicking Add when making a floorplan creates only the list view, which is quick and convenient for getting things published without spending time drawing rooms right away.
Tip: Parent Divisions: One important note is the Division drop down menu at the top of this dialogue. In the event you have nested divisions, it is possible to select any child division to start making a floorplan, then use this menu to navigate back to the parent (shown as a * at the top of the sub menu for that division). This will include all the child divisions on the floorplan, so you could have sub divisions for Mac and Windows in a given room, but still put them all on a floorplan without needing to resort to Tags.
Floorplan Editor
When you Create a Floorplan, the first dialogue you will see asks for a background image and dimensions. These are both optional and can be changed later from the Floorplan Properties, or in the case of dimensions simply dragging the lower right corner of the plan. Simply drag the PNG or JPG of your choice into the dialogue to set the Background Image. While the Sassafras Server provides a suite of drawing tools, if you have easy access to a CAD based floorplan you can save as an image that could be convenient. Once you click Done you'll be in the main editor screen.
In the Ribbon at the top you'll see the map navigation on the left just as in view mode. On the right of the Ribbon you see these buttons:
- Toggle Names - To show or hide the full computer names on their icons. This is only in the editor view as a helper, not on the published plan.
- Clone - to quickly copy a floorplan to another division
- Properties (Gear icon) - Open the Floorplan Properties. Many but not all of these can also be changed from the gear icon in the Map List View, and were discussed above in Map Creation. The additional items are:
- Show Path - Show or hide the display of the Map and Division pull down in the Ribbon. This provides a menu to navigate to other floorplans in the Map Set.
- Show Unplaced Computers - Show or hide computers you have not specifically placed on the Floorplan in a grid under it. Typically you do not want to show these, and the ability to have them hidden means you can make two Floorplans for the same parent division that are entirely different if desired.
- Show Legend - Show or hide the legend of computer statuses on the Floorplan.
- Show Forecast - Show or hide the forecast charts under a Floorplan.
- Show Map - Show or hide the Map under the Floorplan. This can allow for quick hop to another Floorplan in the Map.
- Resize to Fit Page - Turning this off will prevent responsive scaling of the Floorplan to the browser window size.
- Pencil - To exit edit mode leaving any draft changes unpublished
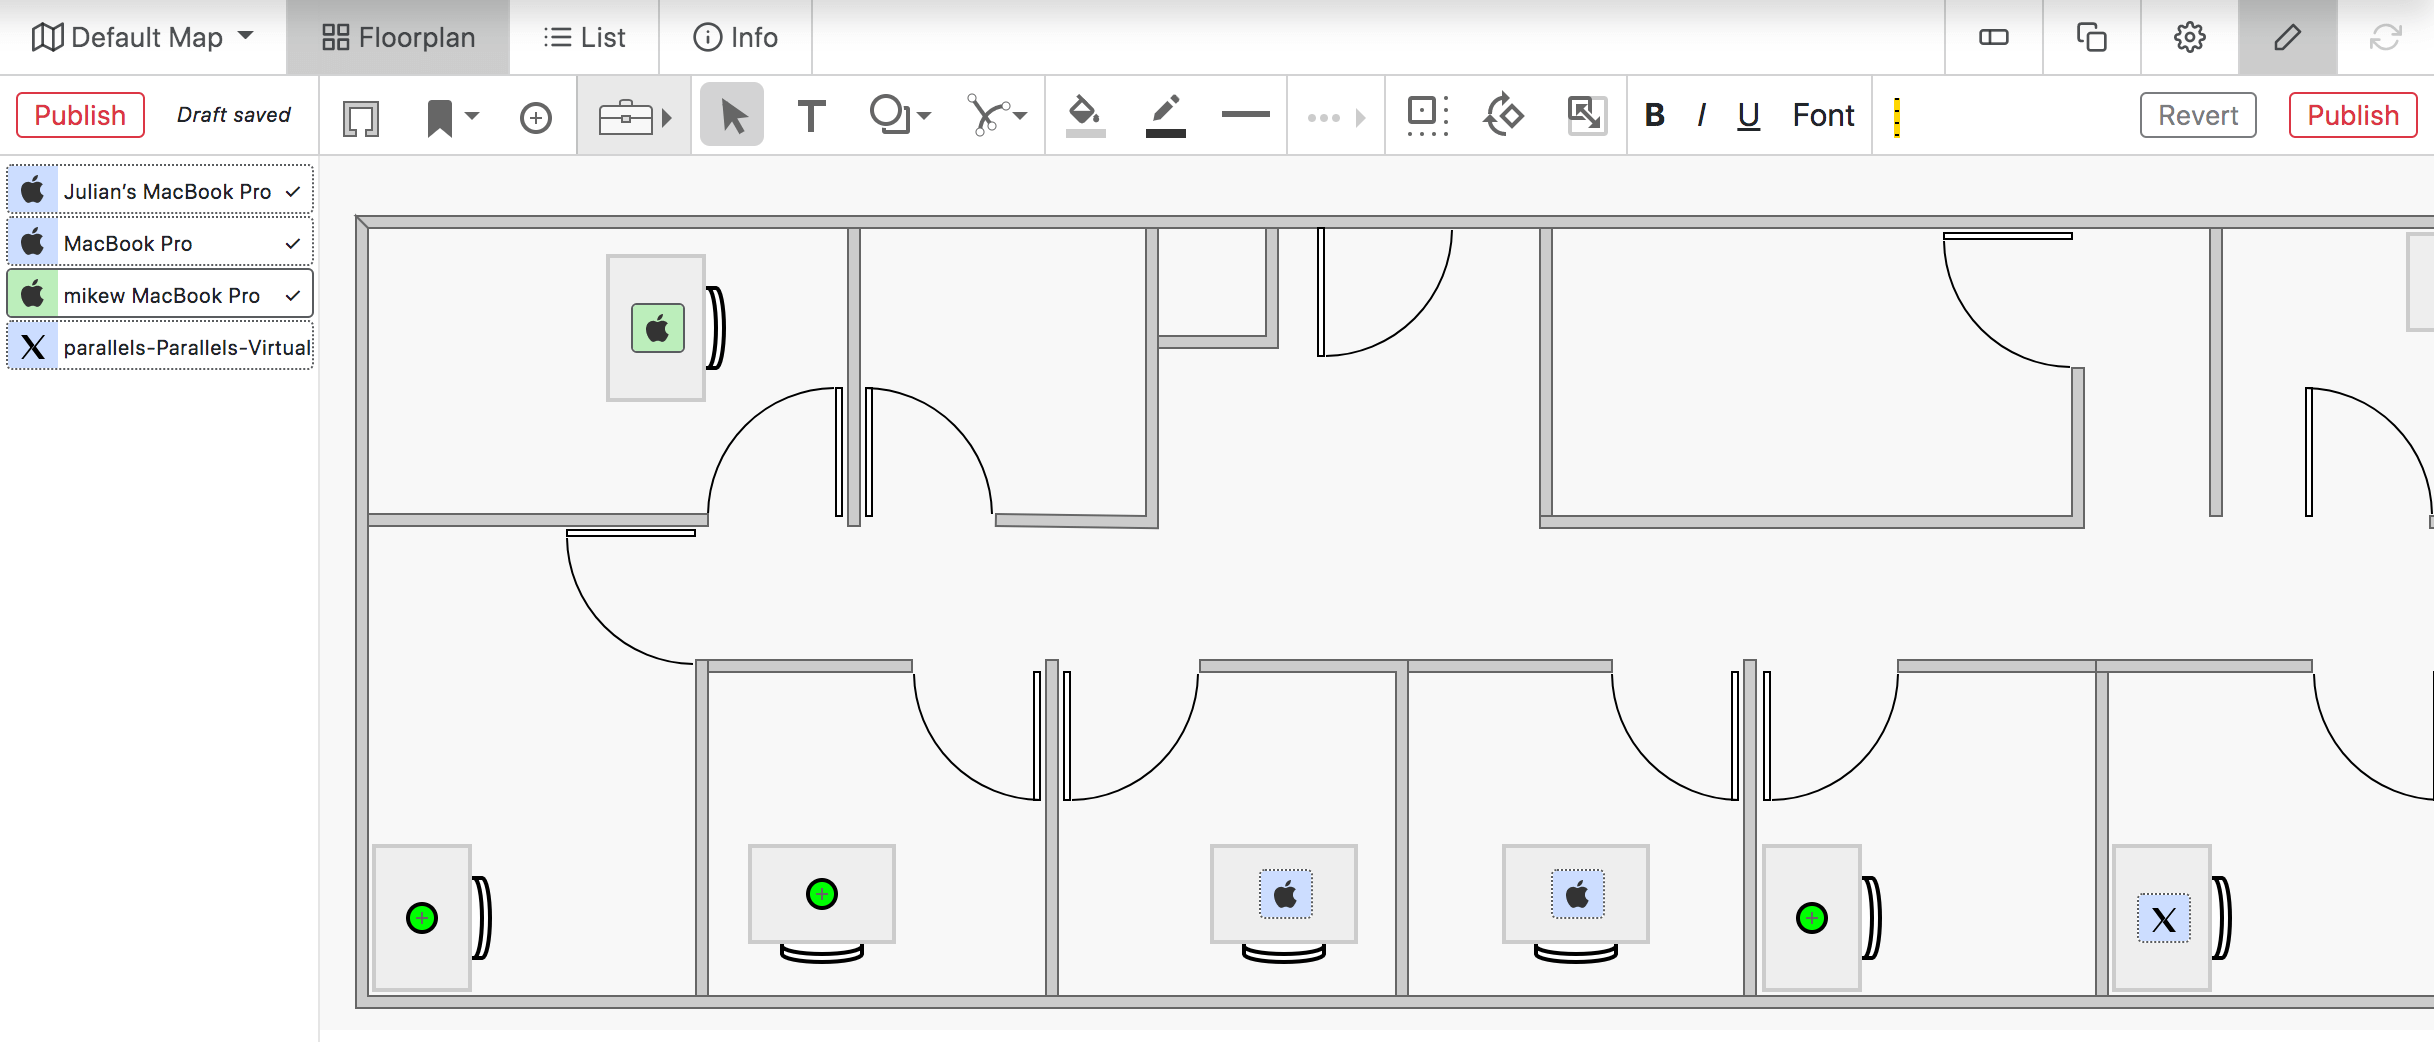
The main toolbar is collapsed by default in most cases, and can be expanded with the arrows at the right of the visible tools. Above we see all the tools fully expanded. From left to right these tools are:
- Publish - This will publish your changes, which are otherwise in a draft mode. Drafts are not lost if you exit editing without publishing, and will be flagged by the + on the Pencil icon in the Map List View. The Revert button is on the far right if you want to discard changes.
- Walls - Wall drawing tool. Single click to place a start point, click for each corner, double click to stop drawing.
- Models - A library of pre-made objects for easy floorplan creation, including desks of various shapes and sizes, exit, accessibility, door, printer, and scanners. You can combine objects and save new models for later use. This also has the custom logo loaded from the Settings, as well as QR codes for mobile device access.
- Snap Point - Many included models have snap points for computers, you can add your own to a floorplan with this tool.
- Toolbox - Just a stub to expand more tools
- Select - Default tool to select an object to edit or delete.
- Text - Place text object.
- Shapes - Draw basic shapes. Note that once you select a shape during a session, changing shapes requires a long mouse click as a single click is just re-activating that tool.
- Lines - Draw a variety of straight and curved lines. For multipoint lines, double click to stop as with Walls. Note that once you select a line type during a session, changing type requires a long mouse click as a single click is just re-activating that tool.
- Fill Color - Choose the fill color for Shapes. This also applies to Text, and can cause the appearance of distortions if not careful.
- Line Color - Choose the outline color for Shapes and primary color for Text.
- Line Width - The width of lines and outlines.
- Other - Just a stub to expand more options
- Snap to Grid - This can help you align objects. You can always use the arrow keys to nudge a selected object as well, even with snap enabled.
- Snap to Angle - This can help ensure a rotated object is at a certain consistent angle with others.
- Resize Proportionally - This locks the shape aspect ratio when dragging to resize.
- Bold, Italic, Underline, Font Style - Self explanatory.
To the far right on the toolbar is the ruler tool. You can use this to draw a temporary line that will show the distance on the floorplan if you want to draw things to scale and check their size or distance.
Object Editing
An easy way to replicate objects is to copy and paste rather than placing each one from the Models menu and moving them around. If you place one desk, you can use the normal copy and paste keyboard shortcuts to clone it. If you position the copy and paste again, the second copy will place at a relative location to the placement of the first. In other words, you can place one copy, then paste down an entire row of desks for the room. You can then select that row, and copy paste to make another row, and then paste 2 more rows at equal distances. In seconds, you can fill an entire room! To see this in action, check out our Shortburst Video on Floorplan Layouts.
Once you place any object, when selected it will have round button with 3 vertical dots in the lower left corner of its selection box. This contextual menu has a variety of tools available for changing the object layer order, grouping, and setting alignment references. Applicable shapes objects will let you change the fill and line color as well. Mousing over each button in the pop up menu will show a tool tip for what it is.
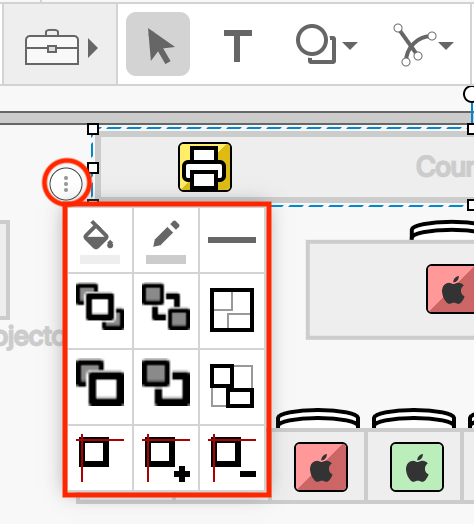
If you drag a selection box around a number of objects, you can group them. Once you group them into a single object, you can still ungroup them, but the button in the context menu will change to Create Model. This will allow you to name your new object and save it into the Model library for later use on other maps. When you mouse over your saved models in the Models menu, you'll see Edit (rename) and Delete buttons in the preview pane. While you can't modify a saved model, you can delete it if you're no longer using it. The system ensures deleting a custom model does not break any maps by having a map specific library as well as the global library. If you delete a model in use, it will no longer be in the global list on another map, but any map using it will still have it listed. Deleting on that map will also remove all instances from the map. You can always revert the map if you make a mistake.
Snap Points
A feature that helps speed up the process of creating new maps is Snap Points. Snap points are simply points on desk or table objects that represent computer locations. When placing computers from the left side bar onto the map, admins can either click or tab to a computer to select it, use the arrow keys to find the correct snap point location, an then type enter to place the machine. You can also drag a computer towards the snap points, and drop when the blue line indicates that the correct snap point is selected (the blue line always points to the nearest snap point when dragging a computer manually).
Snap points can be added with the Snap Point tool in the toolbar to custom objects you design using the other drawing tools. You can then select all the objects making your custom object, group them, and save as a Model as described above in Object Editing. This allows you to make your own unique desk models for your environment, and use them quickly and easily on various floorplans just like the pre made models we provide.
Other Features
Note again that maps can be Embedded in other websites if you prefer to use your existing web infrastructure rather than directing to the Sassafras Server Web UI.
Software Search
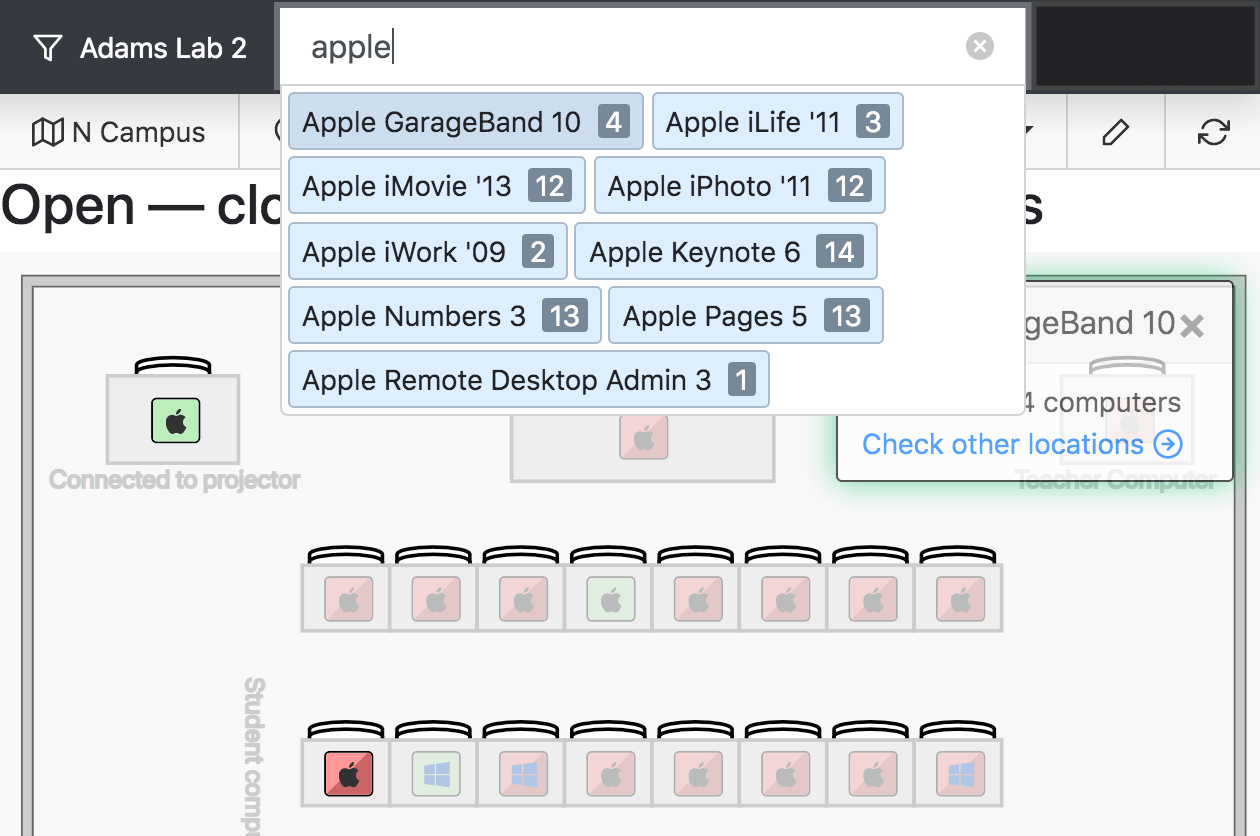
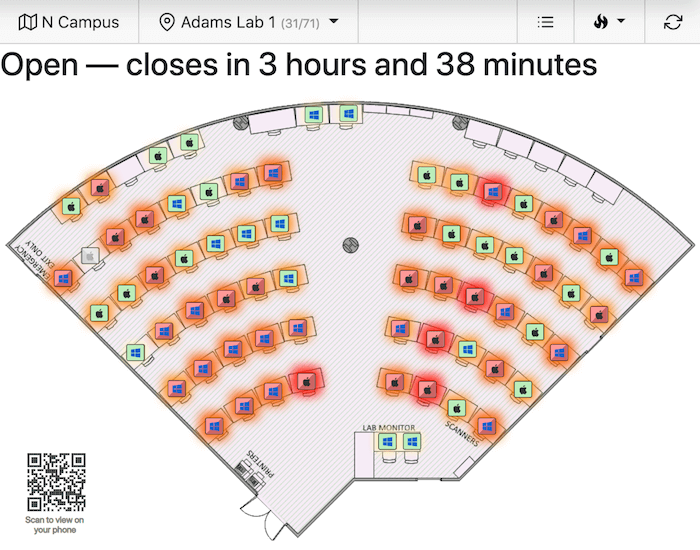
When a map has been completed and published, clicking directly on a computer icon will display the computer name, operating system, and a list of all the software installed on that specific machine. Using the Software settings an admin an choose to hide certain products from not just the Software list, but also this pop up on Floorplans. Using the top Search bar to search for an application name will show a list of matches. Clicking on a specific software title will highlight all the computers in the lab that have the product installed, show an info box in the upper right with the application name and number of matching systems that contain it, and have a link to other locations that have the software installed. This allows very fast search of a program, and finding an available computer to use that has it, and if you have placed Floorplans on the street map, directions to take you to that location.
Floorplan Ribbon
When viewing a division "map", you will see various tools in the ribbon depending on various criteria. From left to right these tools are:

- Path Menu - If enabled in the options, a drop down menu to allow switching to another division in the map set or returning to the main map set list.
- Floorplan View - If created, this tab shows the drawn floorplan.
- List View - This tab shows the default list view of the computers in the division/tag.
- Info Page - This page includes hours, demand graphic, and the ability to add custom markups. See below for more details.
- Show Names - On the Floorplan view, this will toggle showing the computer names.
- Heatmap - Show historic use graphically by the time period selected. See below for an example.
- Reports - Administrators with reporting permissions can run reports right from the Map page for a given Division or tagged computer group, by selecting the report they want from the drop down list.
- Settings - Open the Settings modal to configure the Floorplan options. Note some options can only be changed in the Floorplan Editor.
- Edit - Open the Floorplan Editor (see above for full details) if you are on the Floorplan or List tab, or the Markdown Editor if you are on the Info tab.
- Refresh - Refresh to update computer status. Holding Shift will enable auto refresh, shown with a green outline.
Heat Maps
If you choose to enable them on a given Floorplan's Properties, viewers can choose to turn on a "Heat Map", which will show visually which computers in a lab are being logged into the most. Click the flame icon near the upper right in the Ribbon to select what time period to base the heat map on.
Info Page
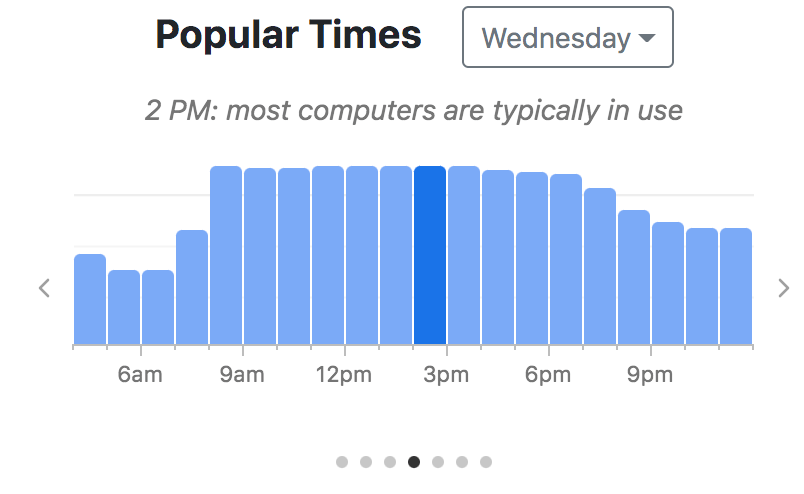
The Info page shows the Status of the lab, the Schedule, the Popular Times chart (formerly Demand Forecast), and any arbitrary information you want to configure via the markdown editor.
Scheduled Hours
Traditionally you would manage open hours from the Time Sets in KeyConfigure by naming the time set using the Division or Tag value of a lab. It is easier now to edit these time periods by simply clicking Edit open hours in the Info tab of the Floorplan.
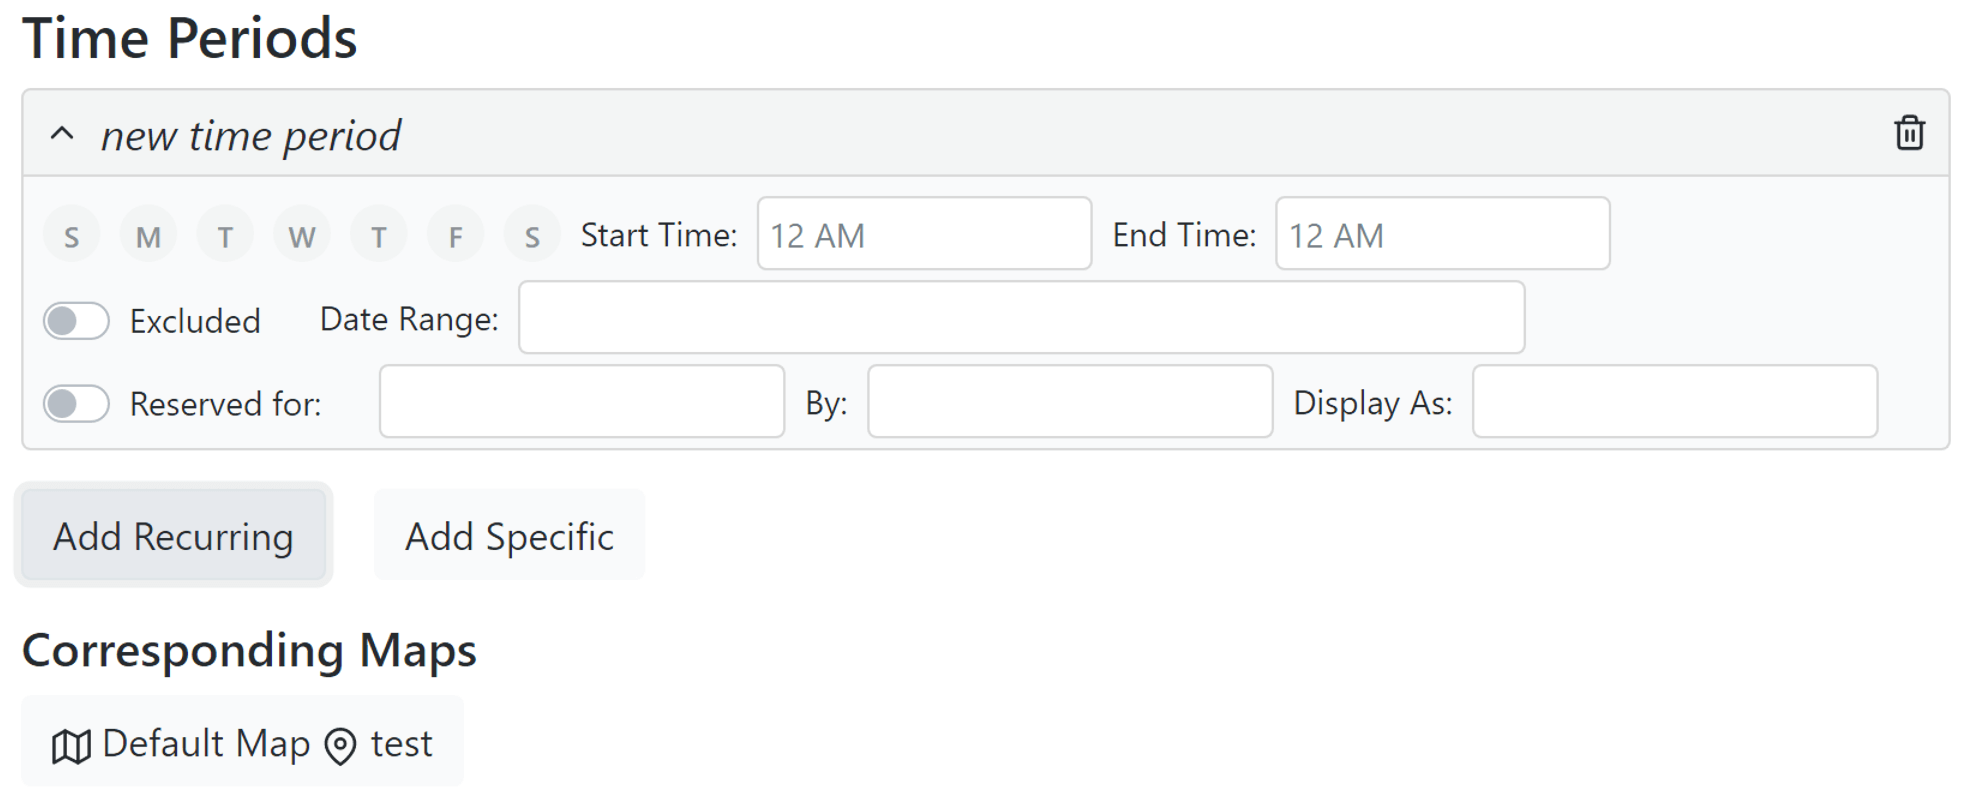
Click the Edit (pencil) icon in the upper right of the ribbon to modify the hours. Recurring time periods apply until deleted, where Specific will apply only for a date range (good for a class that only lasts a few weeks). Note that a Recurring period can still have a Date Range assigned to it, effectively making it Specific.
Excluded periods are used for marking times the location is closed, which will gray out the floorplan and hide Remote links.
If you are using external authentication you can use Reserved time periods. The value used in the Reserved for field must be an external group, and only members of that group will be able to access Remote links during the reservation period. As of 7.7.0.2, the floorplan will be dimmed if you are not a group member, just like an Excluded time period. This means if the group can not be resolved it's disabled for everyone, so beware of typos. The By field is arbitrary reference for the admin, while Display As is what will be shown in the page header as the reason for the reservation. If you do not put in a for group there is no enforcement only display of the reservation. Reservation does not affect local logins.
Popular Times
This graphic is based on historic usage of the computers within the location. If you have added Time Periods for the location, the graphic will reflect this information.
Markdown Editor
Clicking the Edit (pencil) button in the top right when you're on the Info page will open the Markdown Editor as opposed to the Floorplan Editor when you're on the other tabs. There are many sites that document markdown syntax, but the editor buttons will help with common items like adding image and URL links and basic text formatting. These elements can be nested, so you can put a hyperlink on an image for example.
You can also insert raw HTML, however be aware there can be interactions with the markdown tags if you are not careful, and the wrong code could cause more significant page rendering issues. Use HTML at your own risk. Note you need a blank line between any markdown and html lines when alternating or nesting.
Special items you can add to position the default page elements are:
$$status$$ - The current lab status information, i.e. closed or open and time until change and reservation details if any.
$$hours$$ - The display of the open hours per any Time Periods added to the location
$$forecast$$ - The Popular Times graphic
$$location$$ - A small geographic map with a pin for this location.
$$description$$ - Displays the Description from the floorplan Settings - Information tab
It's also possible to add custom CSS type styling to these elements, for example:
$$location|width:300px;border:1px solid gray$$
You can even hide the default elements using this technique:
$$forecast|display:none$$Special notes: You can't use tables and styles together as the pipe character is used by both. There is no markdown for underline.
Advanced Markdown Example:
### My Lab This large multimedia lab has a variety of software resources for all needs. If you are an instructor, click [here](http://mybookingsite.example.com) if you would like to book this room for a class. | | | | |---|---|---| | $$hours$$ | | $$forecast$$ | 
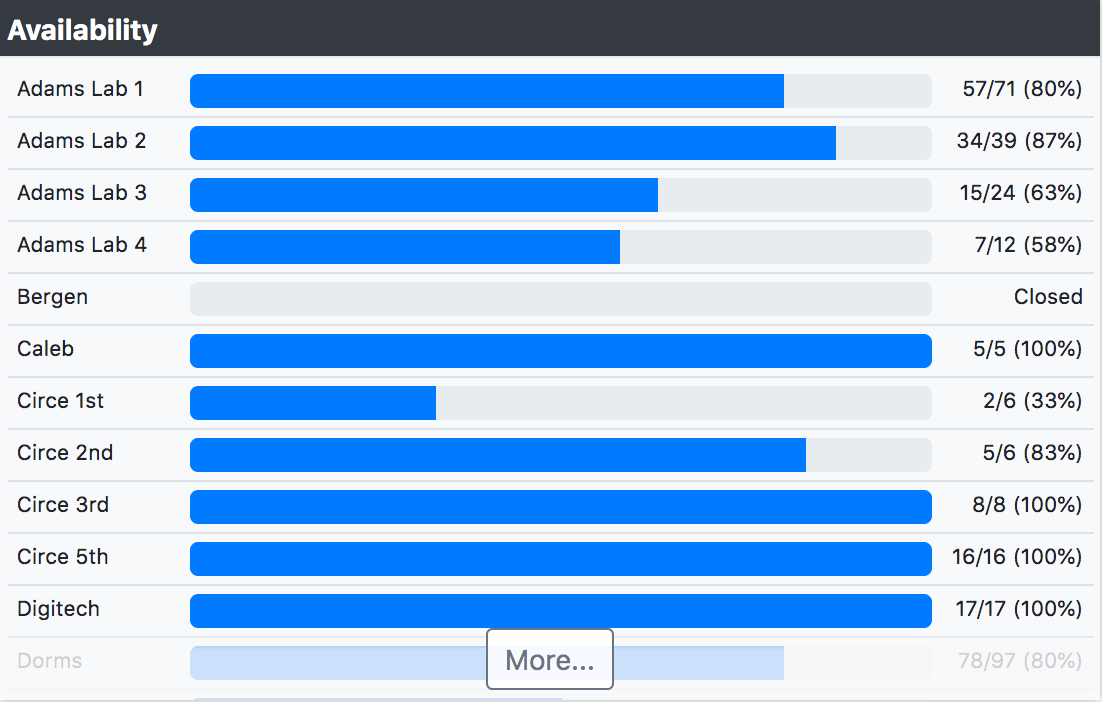
Availability Widgets
There are two types of Availability Widget that can be used on Dashboards once you have created your maps. One shows a simple list of Divisions or Tags on the widget, the other shows a Map of the chosen grouping. These are illustrated below:
As with most Widgets, there are many custom settings for these Availability widgets that can be accessed from the gear in the title bar when you mouse over the widget. These options include the scope for the map, auto refresh, link behavior, and heat map display.