Full Walkthrough
Using the Web UI
In this section we'll walk through all the features of the Web Interface. Links to our standard documentation are provided so you can get more technical details where appropriate. Some of this page is nearly a duplicate of the standard documentation, but this walk through offers a more casual and explanatory approach as opposed to a definition with little context or application of use. The purpose of this page is to get you familiar with all the daily functions of the Web UI.
The Web UI is served up by a sub process of the server called KeyReporter. It is named such as it is the underpinning for web based reports and report scheduling, and has grown over the years into a full Web UI with rich features. Because it is web based, note that browser caching can be a stumbling point for administrators. There is a significant difference between the default unauthenticated Guest view, and the options available to a logged in admin. When moving between accounts browsers can create a dirty local cache. We recommend the use of Private Browsing or Incognito modes when moving between admin and guest experiences to avoid such issues.
We expect the Web UI to work in all modern browsers supported by their creators (Chrome/Edge, Firefox, and Safari are the most tested), but some can handle code differently from others to create subtle behavioral differences. Internet Explorer is not a supported browser and should not be used.
Note that some features are not available in LabSight. Many features are not available in KeySight. An effort will be made to call these out as appropriate. KeySight users especially may not use the Web UI much, other than perhaps a usage widget showing who is using the software being controlled by KeySight. Indeed, KeySight users may want to skip to that section of the tour and return here later if desired.
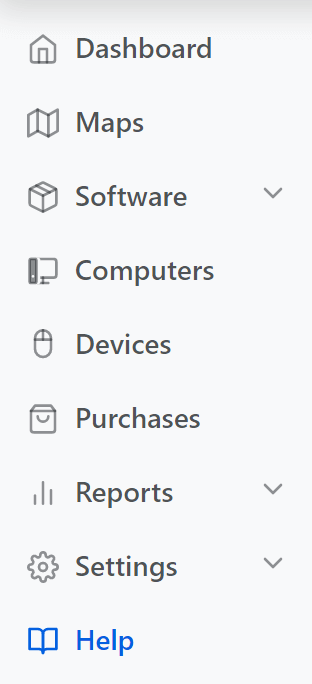 |
We will progress through the sections on the left hand navigation in order through this document, starting with Dashboards and ending with Settings. We assume you are using the Administrator account at this point as we've not yet fully covered Roles and Access configuration for other accounts. Authenticated users will see the objets granted by permissions using these detailed settings, so rich federated access is possible. The Guest view will only see the Maps and Software navigation items by default. It is possible to add a guest Dashboard so that item also displays if desired. It is further possible to open more access to the unauthenticated guest view, but this may not be prudent if network access is widely open. You can also disable guest access and require authentication to view the Web UI, while retaining the default guest level permissions. Some of these topics are touched on through this page, others are more advanced and covered in KeyConfigure. |
Speaking of Tours, you may want to click the ? icon in the lower left of the UI or hit F1 as seen next to the ? icon. This will show you a quick in-page tour of the current section of the web ui you're viewing.
Search
The Search bar at the very top is dynamic. On most pages it will search for only the object type that is relevant to that page. However, when used on the Dashboards page it will find any relevant object across the entire system. It is useful therefore to understand the iconography used in the result list. These will make more sense as we continue through the tour.
Scope
To the left of the Search bar in the top navigation is the Scope button (funnel icon). Clicking this will show a list of all applicable Maps, Sections, Divisions, and Tags that have been created and the items they contain (more on each of these later). Therefore, this menu is blank until you at least make some Divisions (if not the other items), which again illustrates the importance of these containers. When a Scope is applied the name of that Division/Floorplan/etc. is displayed, and all information on the page is changed to reflect only the computers in that Division. This scope will follow you between areas of the UI, so if applied on the Dashboard and you change to Software, you will only see Products that are installed on the machines in the scoped location. Using the scope is very powerful on the Dashboard in particular as your entire selection of widgets will redraw their data accordingly. This makes it very easy to flip from a chart view of statistics for your entire fleet, to stats for only a single lab location.
The Maps page will only show scope options for Maps/Floorplans, not the other categorizations. To clear the Scope, click the x next to the name. If there is no x, you are on a page where you can not clear the scope because the page IS the scope (i.e. when looking at a specific Floorplan). Visiting a Floorplan automatically applies that scope which then follows you to other pages like the Dashboard. Note that Scope will also apply to things like Reports. That is, if you run a report from a one click widget or the report builder (more on these topics below), the results will be filtered by the applied Scope. Again note that the notion of scope is retained across pages, so if at any point you find yourself seeing (or not seeing) data or objects you expect, it's a good idea to check the Scope.
Dashboards
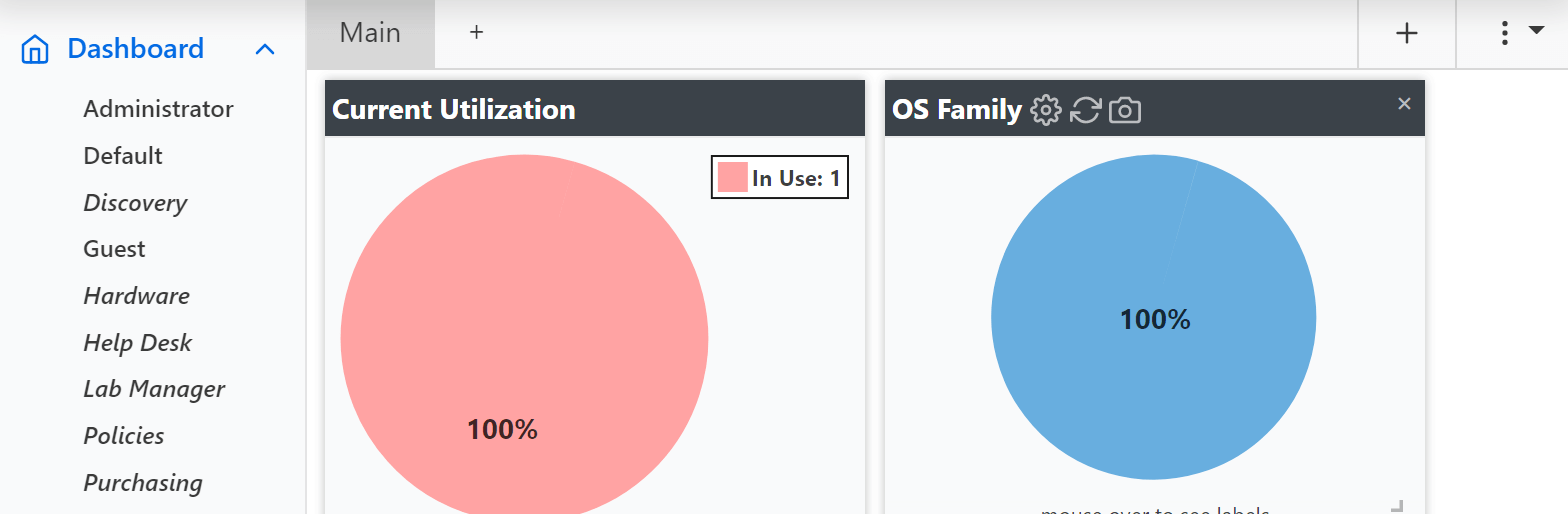
Starting with Dashboards is a little like starting at the end of the road trip, but it's the first item in the Web UI. Once you have a number of computers reporting data for some time, the Dashboard offers a great way to see all that information at a glance. While the primary use of all the collected data is arguably running Reports, we offer a wide array of Widgets that can be used to have instant visualization of various data. Click the preceding links for in depth detail of the available widgets and functions. Here we focus on a casual tour of getting to know the interface, and a discussion of how you might use it.
If you click the ∨ arrow next to Dashboard in the left navigation you expand the list of available dashboards. Any user that gets a dedicated account (not a shared account, both of which are discussed later in Settings and KeyReporter) will get the Default dashboard initially. If they have permission to change their dashboard, one will be created under their account name and appear in this list. An admin with sufficient rights can save any dashboard to another name and alter other dashboards, thereby allowing for setting up a locked dashboard experience for certain users. Clicking any dashboard in the list opens it, which is reflected by that name then being at the top of the list with an x next to it so it can be closed. Any changes to a dashboard are saved in near real time, there is no save or revert option.
By looking through the various example dashboards (in italics) you can see some ideas of how to use this feature. Note some of the widgets will not be interesting until there is more data in the system. The Purchasing dashboard and widgets will not be useful with LabSight as that module is disabled. KeySight has very limited use in most of the Web UI.
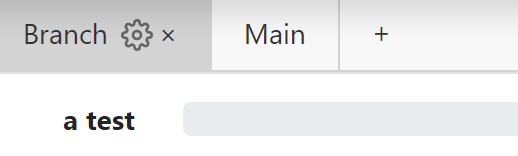
Customizing
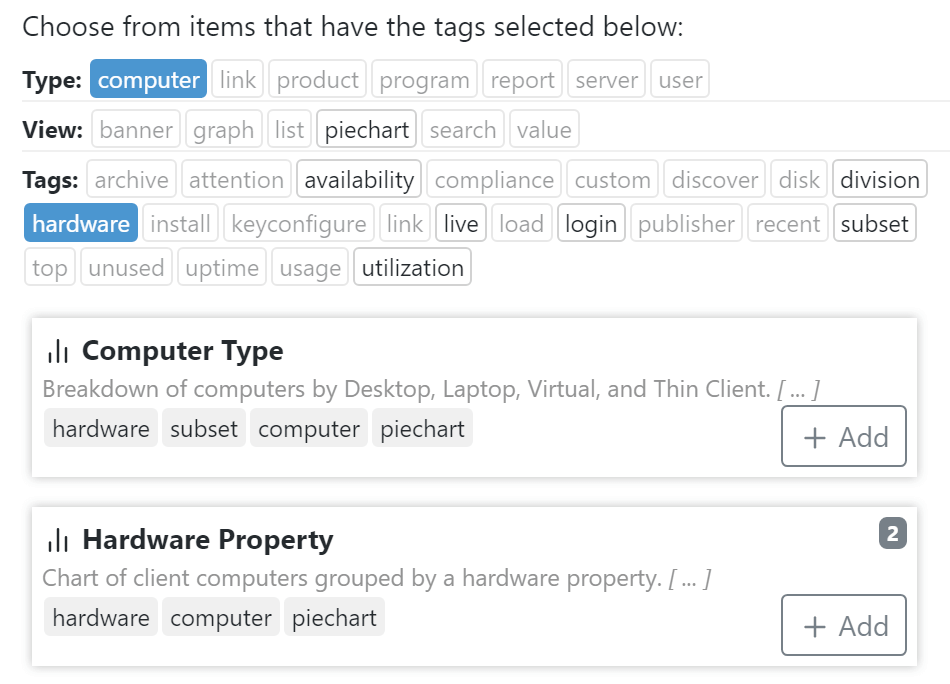
If you click the + in the header next to Main, you can create a new tab. Organizing different widgets into different tabs may be useful. On your personal dashboard you could have a Hardware tab, a Purchases tab, and others, or put everything on one long dashboard if you like. The + in the upper right on the other hand is for adding a new Widget to the dashboard (and current tab). It will bring up a modal with a number of filter buttons by category. Click at least one of these to see the relevant widgets, and multiple to narrow the criteria further. Then click Add on the widget you like.
Once on the dashboard, if you mouse over a widget the tools in its header will appear. There is a refresh arrow that is sometimes useful, although you can simply reload the entire browser window. The camera icon (chart widgets only) allows you to save a snapshot of the current view of that widget as a png or svg for offline use (e.g. put in a Word doc report to the boss). The gear icon opens a modal to allow you to configure the widget. Depending on the widget there may be very few or a great number of options that can be configured. The Hardware Widget for example might be used 4 times on a given dashboard, where each instance is configured to show (and bears the name of) a specific property like RAM, drive space, Model, etc.

The Theme tab in the widget configuration modal allows you to apply a color scheme per widget. The About tab has a short description of the widget. The code tab (the little side to side arrows in the upper right) has the code needed to embed the widget in another website.
Guest
If you select the Guest dashboard you will see it is blank by default. Guests therefore will not see Dashboard in the navigation sidebar and will be taken to Maps by default. However if you add a widget to the Guest dashboard, guests will then see Dashboard by default, and see the widget(s) you placed. Many sites do not bother with widgets for Guest view. Others will add some widgets, and use the Raw HTML widget (which can be found in the "custom" category when browsing widgets) to embed information from other sites or just add arbitrary welcome information. The design is highly flexible to suite your individual needs.
Maps
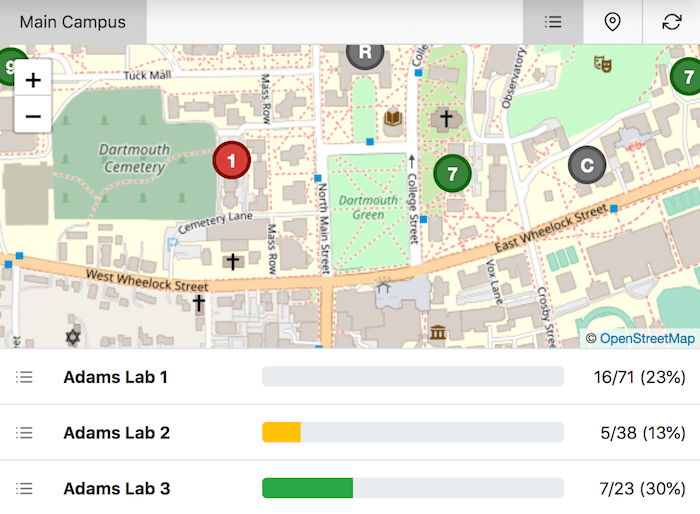
Once you organize computers into divisions you can use Maps to show these groups of computers, either as simple lists or detailed Floorplan drawings linked from a geographic map of locations. When you first visit the Maps you will see a list of all your divisions with information showing their current status based on number of computers. Clicking a line will allow you to make a Floorplan. In this manner, it is very easy to quickly create publicly visible list based floorplans making your fleet available in minutes. You can later use our drawing tools and/or image files provided by your organization to create accurate layouts of the building or room the division represents, and then place computers on the Floorplan in a manner that reflects their physical location in that space.
Map Sets
You can create new Tabs (Map Sets) in the Maps screen by clicking the + at the top. These Map Sets can be based on Divisions (default) or Tags. In other words, a Map is a list or geographic layout view of locations or logical groups of computers. Those in turn as you'll see below can be shown as Floorplans. Clicking the gear icon ⚙ on a tab lets you configure the Properties of that map set. You can make entire sets visible to the public or not, so you can have internal maps for IT use compared to public labs for student use. This also allows you to make Floorplans in a set publicly available without enabling public access to the entire set to see the list of floorplans. While there is no way to browse to those floorplans in the UI (effectively blocking unwanted access), you can provide direct access to the Floorplans in question by supplying users with the appropriate URLs. Remember that as an admin you will see all divisions under each tab, but until you both make a floorplan and set it as public, nothing will be seen by the Guest view. This means you can name the tabs for branch locations of an organization, and put the relevant floorplans under each tab. While you see all things listed, the users see a nice organized UI of labs by location.
Maps can be very useful in education for visualizing a lab. You can see which machines are available, what software they have, and even show printers with their status information. In corporate settings, using maps for IT staff can be useful to again see building layout and computer status. Public maps are available to the guest view. Maps that are not public can be visible to authenticated users based on roles and permissions.
Floorplans
As a Map is a collection of division or tag based floorplans, a Floorplan is a List (default) or drawn Layout (optional) of the Computers in said division or Tag. Each floorplan can be configured with a number of settings as detailed below. The main Information tab in the Properties window allows you to set a friendly Name and Description. Divisions based on AD groups may have technical names, so setting a Name that makes sense to the everyday user can help clarity. The Description will show in popups when you click on the Division on the Geographic Map (see below). If you use a standard naming convention with a prefix, you can put in the prefix in question for this division to hide it in the name of the computers when displayed. That is, BLDG1-Comp3 will be simply shown as Comp3 if you put in BLDG1- for the hide prefix value.
The Location tab is more of a curiosity to see the coordinates once the floorplan has been pinned on a geographic map (see below). If you happen to have coordinates you can put them in manually.
For those wishing to leverage our Remote options to facilitate off site connections to an available machine, we offer a rich array of remote settings. Please see the linked documentation for more on those.
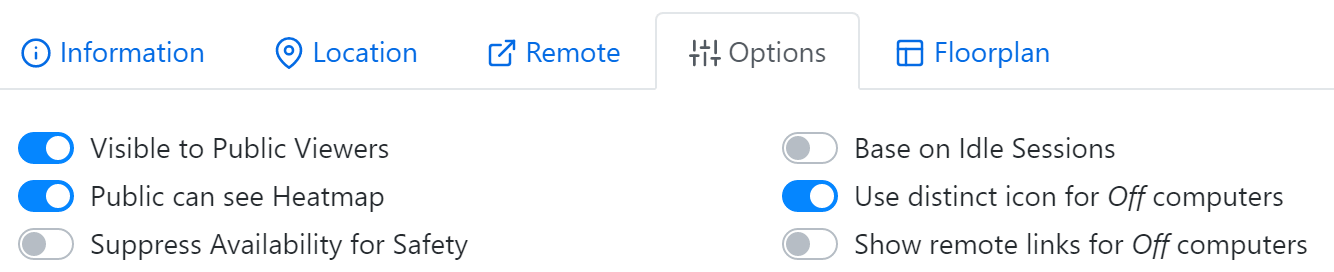
The Options are documented as well, but let's explore some use cases for these items.
Finally the Floorplan tab will allow you to enter the Floorplan Editor and actually draw and lay out the location graphically, including using a background image if desired. You then place the computer icons on the layout to show location and status. This is entirely optional as computers will be shown in the simple list view if you don't create a Floorplan Layout.
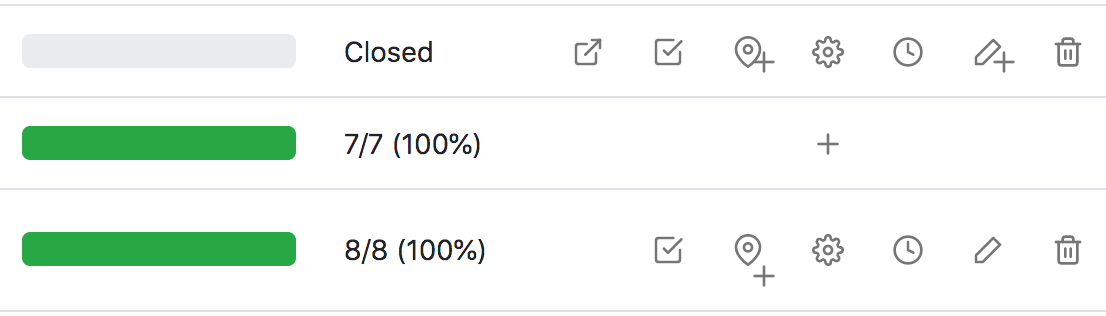
Once you click Add you'll see in the Map list that the division has a number of icons on the right of the screen (see image). From left to right these are:

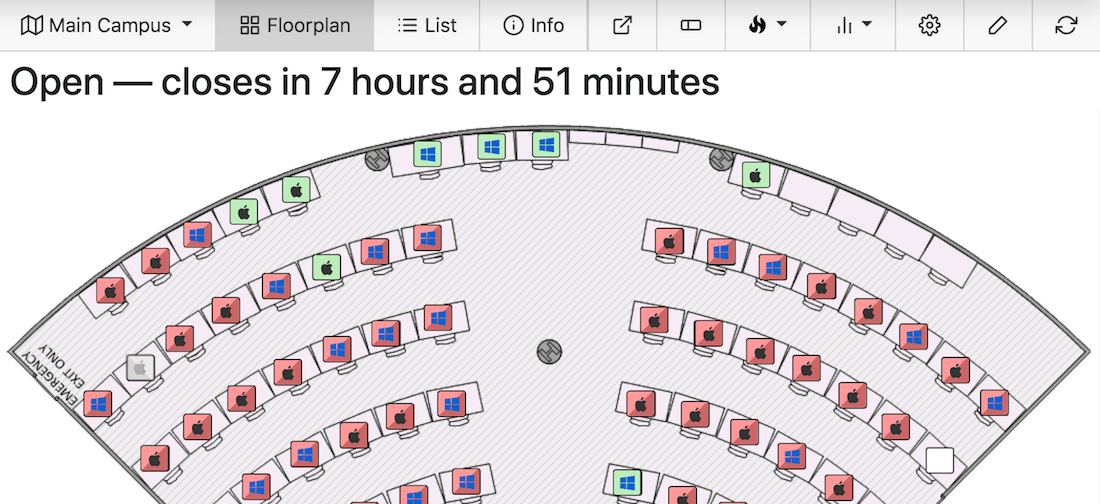
If you click on a division that has a floorplan, you will see the list view by default unless there is a drawn layout. There is a ribbon at the top of the screen that allows you to flip between layout view, list view, and the Info page. At the other end are buttons for toggling computer names, viewing heatmaps, running reports, and configuring and editing if you have the proper permissions. The far left drop down button allows for quick navigation to other floorplans without returning to the main Maps screen. Note the edit (pencil) button will enter the layout editor if you are on the Floorplan or List tab, but will open the Markdown editor if you are on the Info tab.
Software
The purpose of the main Software page is to show a convenient list of all software in the environment in an easy to search list. You can sort by any of the criteria at the top, of which Publisher and Category are self explanatory. Popular is based on usage as determined by Policies. Recent is cookie based for the local session based on prior searches. Guest viewers can click a software title to see a resulting list of any Public Floorplans that contain computers with that Product. If the Product is only on computers in non-public locations, no results will be found. There is also a link out to the publisher website for the product. As an Admin you can also see the install count (machines that have the product) and click to see details of the product (more information on this below).
Manage
For admins of proper privilege there is a sub menu to Manage Software. This provides an easy way to work with some concepts that are also covered in the KeyConfigure sections of this Tour under Products. The two main functions here are deciding to observe or ignore usage (track application launch and quit times), and controlling visibility on the various lists in the Web UI.
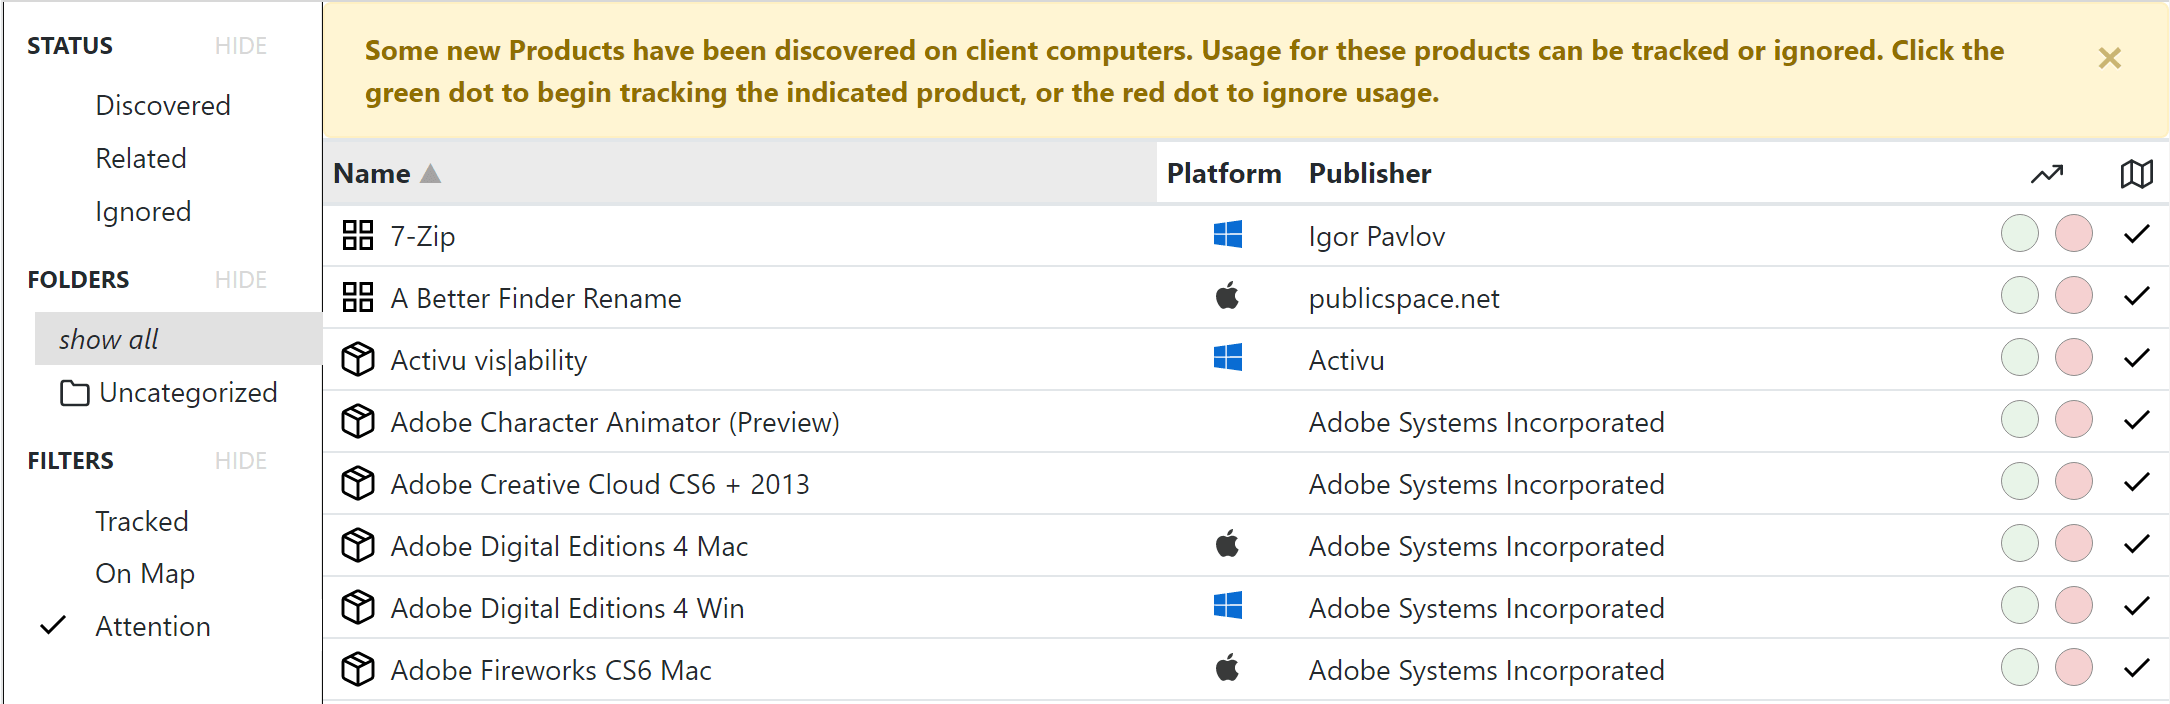
On the left is a series of items you can select to filter the list of Products.
It is important to remember that Usage of software (who, when, where, how long) is only logged if there is a Policy. This Web UI offers a simple interface to manage Policies without any understanding of Policy types and their numerous options. As the LabSight tier of our product only offers Observe policies, this web UI is all you need to manage your tracking, where as AllSight customers will likely leverage KeyConfigure to work with more advanced software controls.
So, you can simply click a green dot to Observe (Track) a Product and the server will handle the rest by making a simple Policy. You can click the red dot to choose not to track, which will delete a related Policy if one exists, or simply remove the item from the Attention filter. The checkmark in the far right column dictates if the item will show on the main Software page, as well as in the popups when you click on Computers on Maps. This allows you to hide things that are more utilitarian and not important to the daily users. You can still report on inventory and usage, this option is strictly for web display purpose.
The last thing to understand here are the two different Product icons you will see.
Details
If you click on any given product you will be taken to the details page for it. A sub navigation pane on the left allows you to choose the section of the product details to look at. An important option here is on the Categorization pane where you can turn off Show in Availability Lists. This will hide the Product from the Software page entirely, which is useful for items installed only on private machines as well as ubiquitous security software users are not interested in.

Note that while you can click the pencil icon in the upper right to edit records, many will be replaced with defaults when the product is updated on PRS. However some like the Web Description, External URL, and Notes will not. The Web Description test replaces the standard Description from PRS. Likewise the External URL overrides the Product URL. Any text added to the Notes will become searchable (but not viewable) text on the main Software page. You can use these to customize your environment as needed. Edition Products will have options to see the Programs they contain as well as the Family they are a member of. For Family products you can see a list of Editions they contain. There is also a list of Computers the product is installed on. The top right drop down menu allows you to run a relevant report on the current Product.
PRS
The PRS sub item under Software allows you to search for and import Product definitions from our Product Recognition Service, our cloud-based repository of thousands of common Software Titles. These definitions normalize discovered Programs into Product that you can track as previously discussed. Without a definition from Sassafras, you need to use KeyConfigure to create your own Product from the found Program(s).
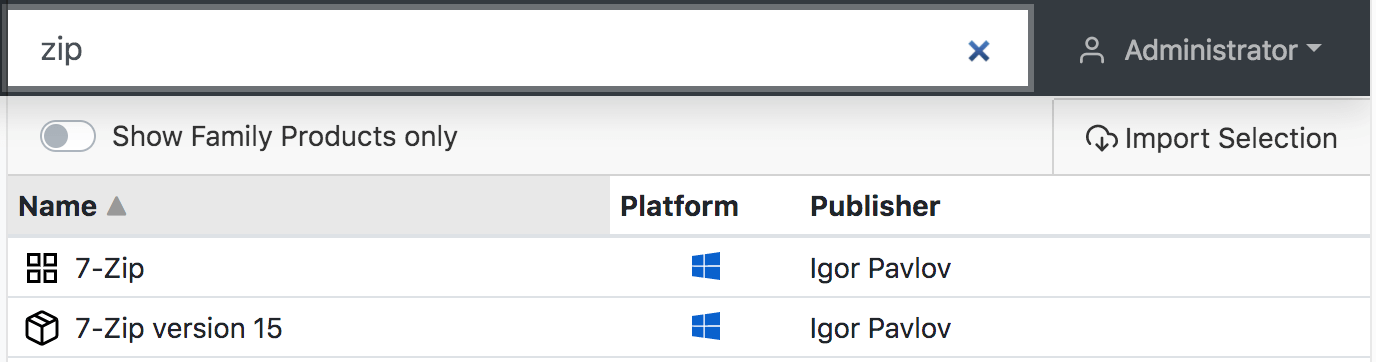
Simply enter text in the search bar at the top and hit enter. You will be shown all items that match that keyword by product name or description in some way. You can then click on items you want to pull down to your server and click Import Selection. Normally this is not needed as the server will automatically pull down definitions nightly that match discovered programs on your computers. However, you may want to get ahead of that nightly process with a freshly deployed application and pull down the Product manually and start tracking it in the Manage section above. It can also simply be useful to verify if Sassafras Software has a definition for an item that is important to your organization. If not, we are happy to work with you to create one and add it to our catalogue in most cases.
Computers
This screen allows for basic viewing and organizing of your Computers into Divisions. Each Computer object is a record created by the client talking to the server which then references the hardware, software, and manual data associated with that machine. Computer records can be created manually for offline or pre-staged equipment. Division is the hardware specific term for Folder when it comes to Computers and Devices. You can also create Sections, which are containers of divisions that are an Access control mechanism.
Divisions are very important when it comes to Maps as they are the foundation for that functionality. They are also very useful for reporting, both in reports that group results by Division, and as a way to limit computer based report results to those systems in a given Division. Click the + next to Divisions to make a new one, and right click on an existing Division to edit or delete it or make a nested division. Applying a color to a Division applies the color to all computers it contains. Selecting a Division filters the main pane to show only the computers it contains, along with any computers in nested divisions. Note that if there is a Scope applied (top navigation) it filters this entire page so only that Division will be shown in the sidebar. Typically you want to clear that scope when working with all computers/divisions.
Division structure can be completely manual, or totally automated by way of something like Active Directory. The Computers can self organize and self create the needed divisions to match their structure in OUs in AD. This was an option during the initial setup covered previously, and can be turned on in Settings -> Clients as desired. The system does not clone and import the entire AD structure, it is created as needed on demand only when clients check in.
Working with Computers
To move Computers into Divisions or Login states, simply drag and drop.
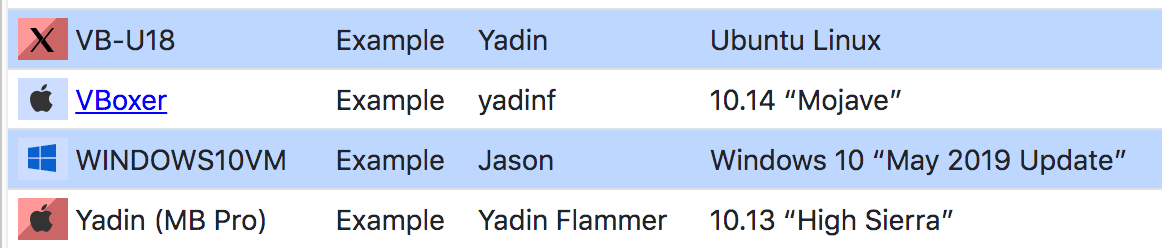
You can select multiple computers by using Shift+click for a range or control (Win)/command (Mac) click for non contiguous items. Be careful to click on the icon or line of the computer NOT on the name of the computer. Once you have multiple records selected you can drag and drop to move them.
You can perform bulk actions from the upper right drop down menu ⁞ ▾ or by right clicking one or more selected Computers. Quick Edit is very useful for making a bulk change of one or more fields. Request Audit asks the selected computer(s) to submit a new audit ASAP instead of waiting for the default cycle. Anchor means that the computer(s) will not move based upon Rules or AD mapping, they will stay in the current assigned division. You can also run various Scrips and Reports from the the sub menus.
Other buttons in the upper right ribbon include the + to add a manual computer record, the Details ◫ dialogue to choose column display and order and Grouping display, and a refresh button.

Clicking the name of a computer (hyperlink) will take you to the Details page for that computer.
Computer Details
The Computer Details are broken out into sub navigation items you can navigate between as shown below. Each section is a grouping of similar data points about the computer record. It is worth noting that not all data collected on hardware can be seen in the details screen. KeyAccess collects over 80 possible data points from a computer, most of which are directly viewable in the Details of the computer record, as a column on the Computers page, or in a Computers Report. These include things like the video card, network card, and much more.
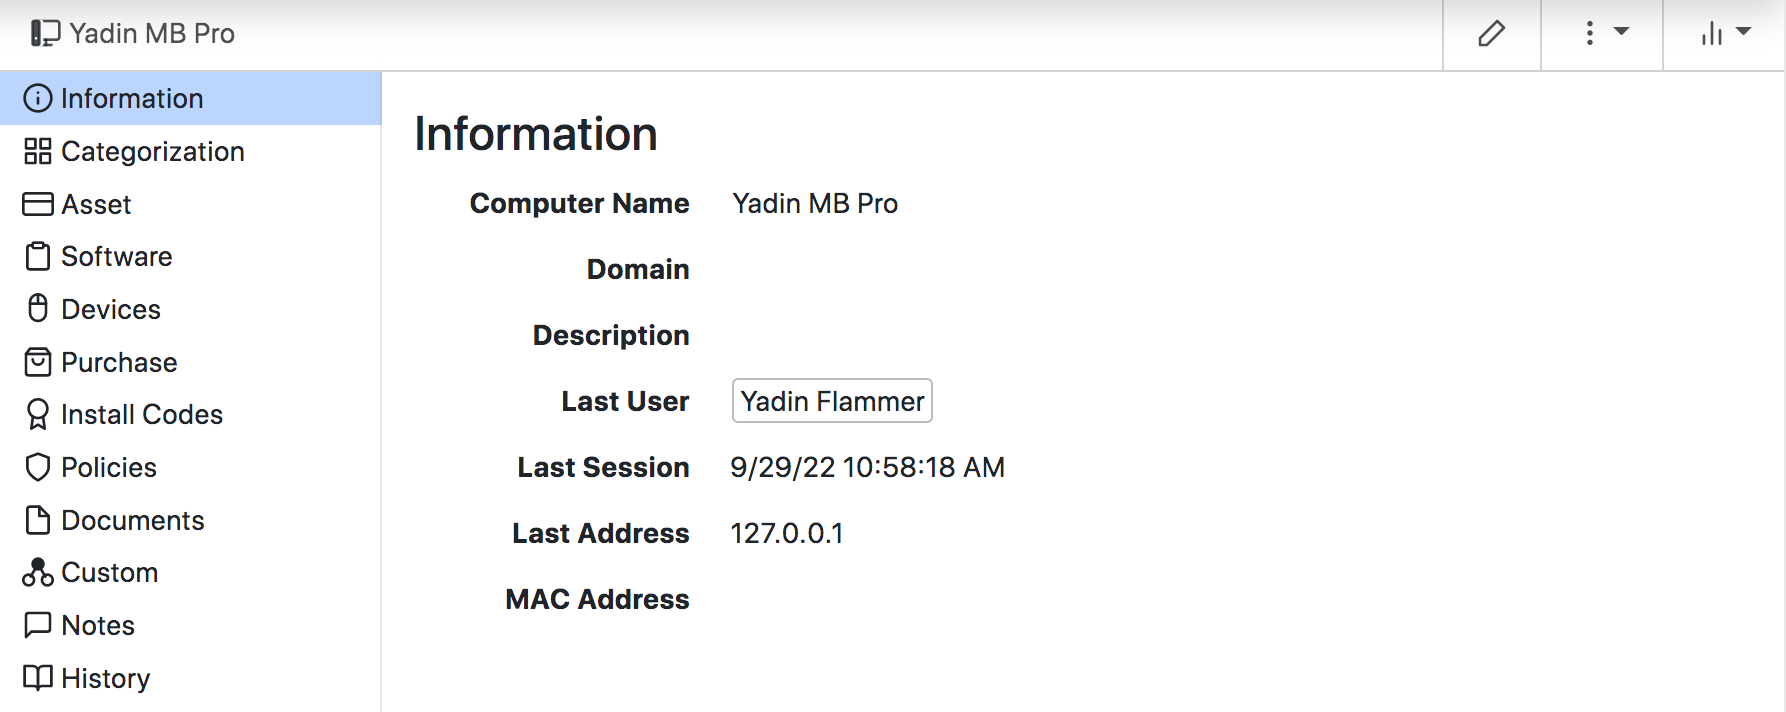
Some fields like MAC, Serial, and Memory have a More button next to them. This will expand a list of other interfaces, identifiers, and individual ram chips. Some fields that can not be edited in this view can be altered using Quick Edit on the main Computers page, but note that may mean they will be "fixed" by data from the KeyAccess client at next checkin. For a full list of panes see the main Computers page.
Clicking on the name of the Last User in the Information screen will take you to the User Details. There you can see and edit some basic user information if desired. Note this is not in any way related to user authentication or the control of those accounts, it is simply a record of the user name associated with the usage of the Computer and Software.
To Edit any of the editable fields, click the Edit button at the bottom of the side navigation, or the pencil in the upper right. To save your changes, click Save or the pencil again. To discard changes, click the Revert button or arrow next to the pencil. Note there are advanced capabilities where some of these fields (like Department and Owner) can be auto populated by registry/plist values from the clients. In such a case, any manual edits will be overwritten by the next audit unless you Lock the fields using that option on the Asset pane. The Custom fields can be managed under Settings - Columns.
Lifecycle Management
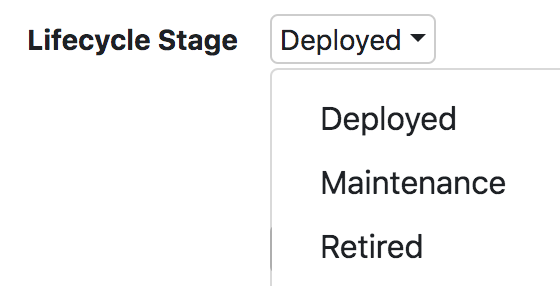
There are a few fields that are directly related to lifecycle of the asset (Categorization and Asset panes) if you wish to use these features. Note there is also an ability to import computer records from CSV to "pre-stage" them before KeyAccess ever checks in from that machine. We have other articles on that process, but this is why there are Lifecycle Stage options for Ordered and Acquired. The default stage when a client connects and a record is created is Deployed. Changing this to Maintenance has the impact that it will be grayed out on Maps. Any other status will hide the computer from the Map entirely. Otherwise, these statuses are for your internal use as you see fit. You can show this column and sort by or group by it on the Computer page, and use it in Hardware reports.
The Login setting on the Categorization pane has some important functionality discussed further under Licensing. By default this is Dedicated and in most cases should remain as such until a machine is retired. At that point change it to Dormant. This means the record will not be taking up a seat of your Sassafras Server license, and the computer will not appear in software Audit reports as it's no longer in inventory. However, it will appear in Usage reports for historic data, and you can reference the hardware record as needed, including linking to a Purchase record. Computers automatically move from Dormant to Leased if they check in to the server. This can service as a flag that something was not properly retired as expected. Excluded computers are prevented from connecting and therefore can not get a lease or access policies, but as with Dormant the usage data is retained and reported on (while audit is ignored). Generally speaking, moving computers to Dormant or Excluded is preferable to deleting them so you retain the links to the data.
Click here for more consideration on Login types.
Because a Leased computer will automatically time out to Dormant after 30 days max of inactivity, some wonder about running computers in Leased instead of Dedicated. This decision comes down to a few important considerations about your workflows and lifecycle management. Most sites use the default of Dedicated, but you are welcome to change this.
The Confirmed fields on the Asset pane can be useful for internal auditing procedures. If you have staff able to edit computer records and they are verifying computers, changing status as part of a workflow, etc, they can click Confirm when they are complete. This stamps the record with their login ID and the date and time of the confirmation, which allows checking to see who last confirmed a machine if something is found to not be compliant.
The History pane automatically tracks changes to assets. This includes not just manual details in the Asset pane like Owner and Department, but also configuration information like RAM size. Importantly for the manual fields, the account making the change is recorded along with the change details.
Basic Purchase information can be entered here, or the record can be linked to a full Purchase record (AllSight only as LabSight does not have the Purchases module). This link will take you to the full Purchase record with all the associated details.
Other Features
Various Reports are available from the top right menu icon.
The Map Availability option is relevant to using the Remote features on Maps. For example, selecting Physical Only will hide the Connect link on a Floorplan for that computer even when Remote access is enabled in the Floorplan settings. It also can be used to prioritize which computers are offered for remote connections when using the Connect to Any button in the map list. Remote Only will be used first, followed by Physical and Remote.

The Auto Logout option indicates that if there is a disconnected remote session, KeyAccess will log it off after 3 minutes. Note this only applies to RDP and (in most cases) VNC. This helps address the issue of users closing an RDP connection without logging off of the OS on the remote machine.
Devices
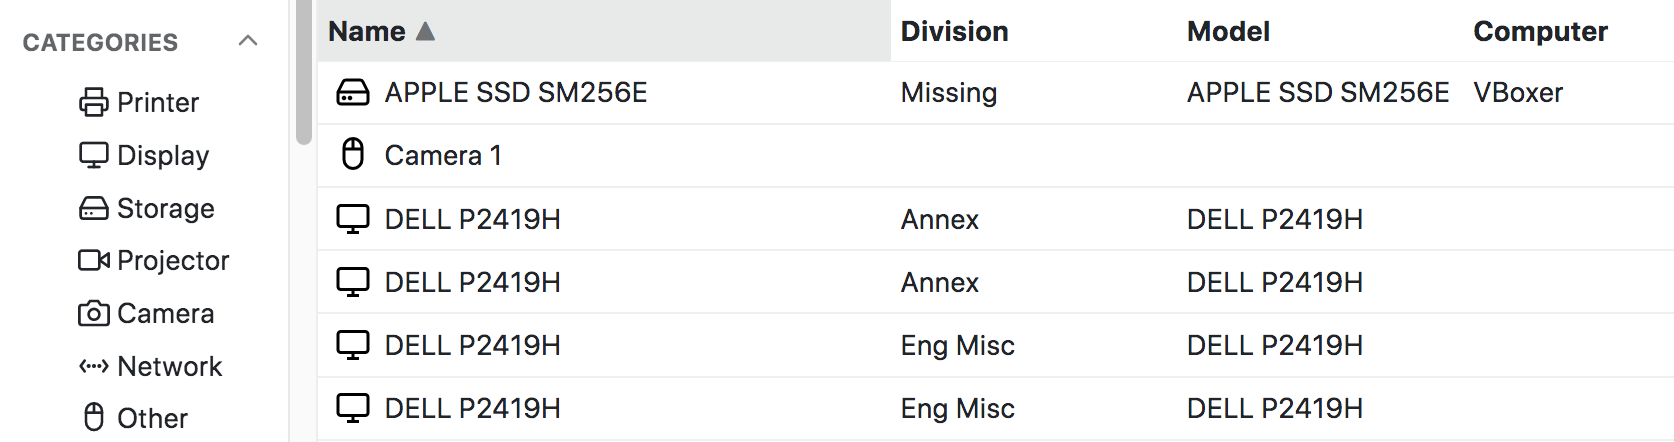
The Device page allows you to manage your inventory of active and offline equipment. This is very similar to Computers, but with much less data and no active agent. Printers can be actively queried by IPP or you can use our Papercut integration. Any Display or Storage device the KeyAccess agent can discover with a Serial Number will be automatically added to the inventory. As of 8.0.0.5 USB Printers will also be discovered and inventoried. Devices can be created manually with the + in the upper right, or by bulk import from CSV (Import option under the drop down menu in the ribbon).
By creating a printer and putting it in a Division, you can place it on a Floorplan just like a Computer. This allows for even more robust Maps. If you specify an IP for the printer and use the IPP service, we will query the device and update the status every 5 minutes by default. Printer icons will change color if being queried for status. Green means it is ok, yellow in a warning state, and red in an error state.
The displayed columns and optional attribute grouping can be customized using the Columns button in the upper right ribbon. Click a device Name to go to its details page, which like computers has a number of sub items with a rich array of details.
Information
This pane has the general overview and classification of the device.
You can define custom Types in Settings - Columns. This is useful for Other where you can add anything you want like vehicles or furniture. Some examples of fields that are dependent are Resolution for Cameras, Dimensions for Displays, and Brightness for Projectors.
Printers have a few fields of special note:
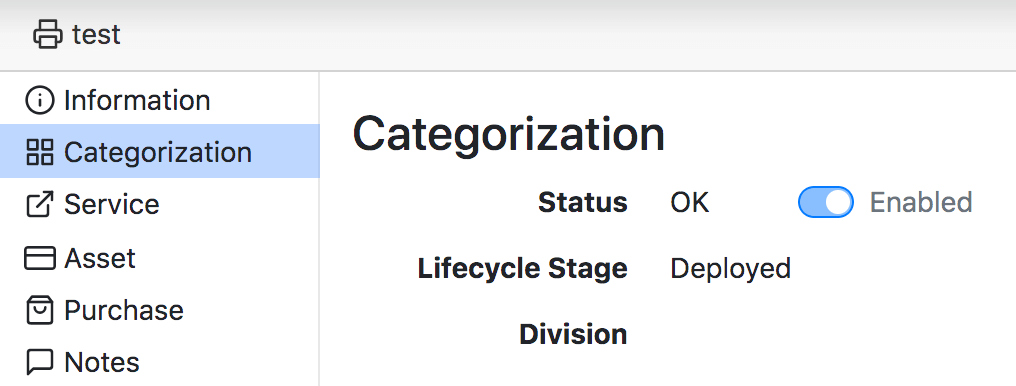
Categorization
This pane has a few items for organizing the device. Division should be familiar from Computers. A device will follow a Computer it is linked to unless it is Anchored. For Printers, the Division allows for Map placement, and any maps the device has been placed on will be listed at the bottom of the page.
Description is arbitrary information as needed, but in the case of Printers this is shown when you click on the device on a map. Tags are a more advanced meta tagging subject.
Service
The Service pane is where you select to use IPP to enable automatic updates for the device. If the printer is automatically created using the Papercut integration this will be set to Papercut and the ID and URL will be populated. You can manually populate the Service URL if you are using IPP to enable a hyperlink to the web interface of the device for administrators to use from maps.
Asset
Here you can manage the Lifecycle Stage as with Computers. You can also populate a variety of fields with information about the device. All of these are optional but can be very useful in tracking the device in the organization.
The On Loan fields are intended for loaner devices. The To field has a search function that will list matches from the Users database, which is populated with users who have accessed a Computer with our agent. The Until field can be leveraged with a Dashboard Widget to show upcoming returns that are due, as well as in Reports.
The Confirmed fields are populated when an admin user clicks the Confirm button. These set the date and time as well as the user to indicate who last modified the record.
Purchase
These fields can be used to track purchase and warranty information among other details. You can link to a Purchase record which then provides for a large number of details related to the purchase of the device.
Custom
You can define up to 10 Custom Fields to use as needed with Device records.
Notes
Additional details about the device can be added to the fields in these panes. The Confirm function works the same as with Computers, to stamp a user and date when the device was verified by manual audit.
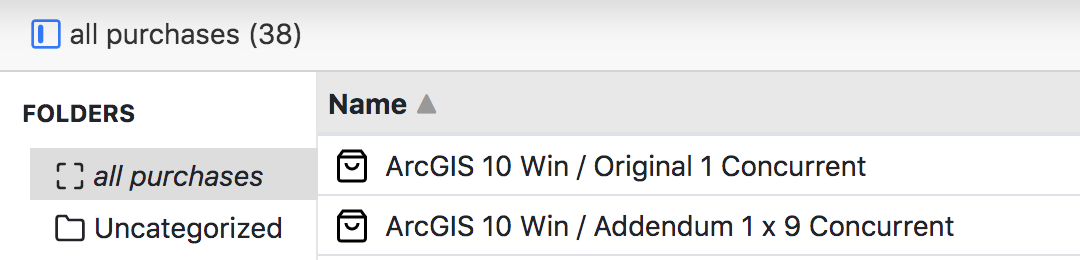
Purchases
Note this module is only available in the AllSight tier. This page allows you to view and create purchase orders and purchase records. You can then link these purchases to Products, Computers, or Printers from either the Purchase details or the details page of any of those items. Folders can be created to organize purchases further. You can also leverage Filters for complex search criteria, and Tags for organization and more complex meta grouping.
Like the Computers and Printers screens, each Purchase is shown as a line item which you can click to go to the details pages of that purchase. When you create a new Purchase, be sure to use the PO number to create the record. You can then add additional purchases to that same PO later. The PO# can not be changes in the Web at this time, but can be altered in KeyConfigure.
You can read about all the available fields for Purchases in our Purchases Documentation. Also note that bulk import of purchase records from CSV is possible using Import under the pull down ribbon in the upper right.
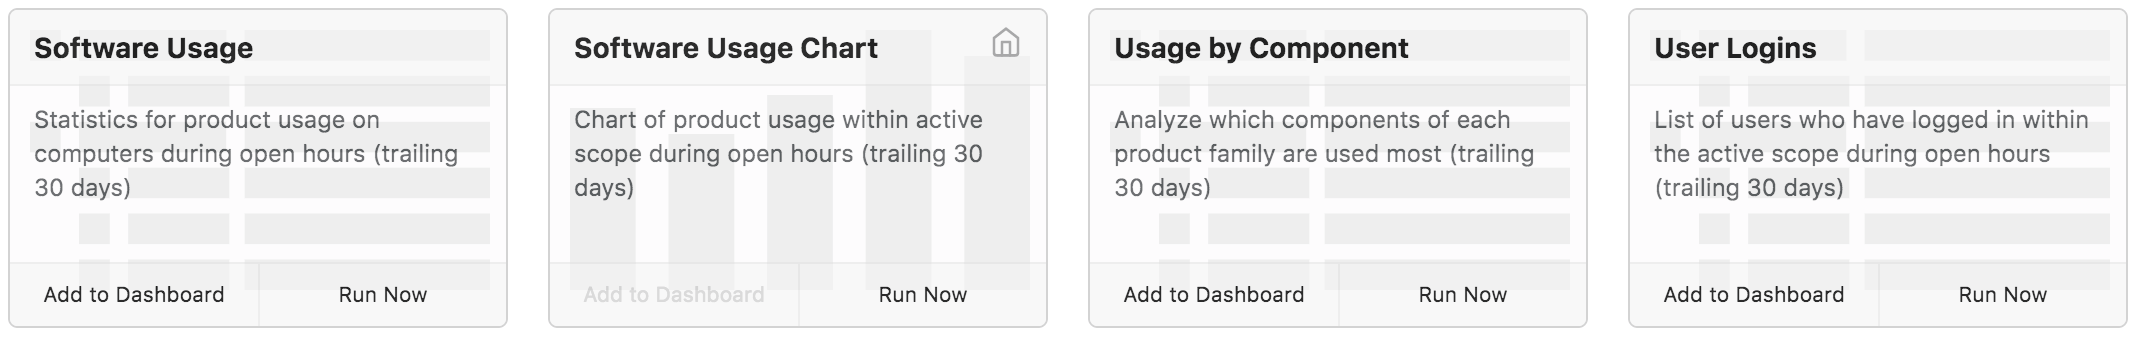
Reports
To leverage all the inventory and usage data collected, the Sassafras KeyServer Platform has a rich set of flexible Reports you can run. While the Dashboard provides a visual overview of data, Reports allow a more deep dive into the data. The main Reports page is a sort of dashboard of prebuilt one-click reports. We include a few for examples, and you can make your own in the Builder. These widgets simply have a name and description and buttons to run the report or add the tile to your personal Dashboard. Clicking the ∨ next to Reports will expand the sub menu items detailed below.
Saved Reports
This sub page for Reports is used to manage Saved Reports. This includes actual report results, as well as templates for Scheduled and Run on Demand reports. Similar to the Computers page, you can create Folders to organize reports. Advanced settings to control which users have access to which folders are managed in KeyConfigure.
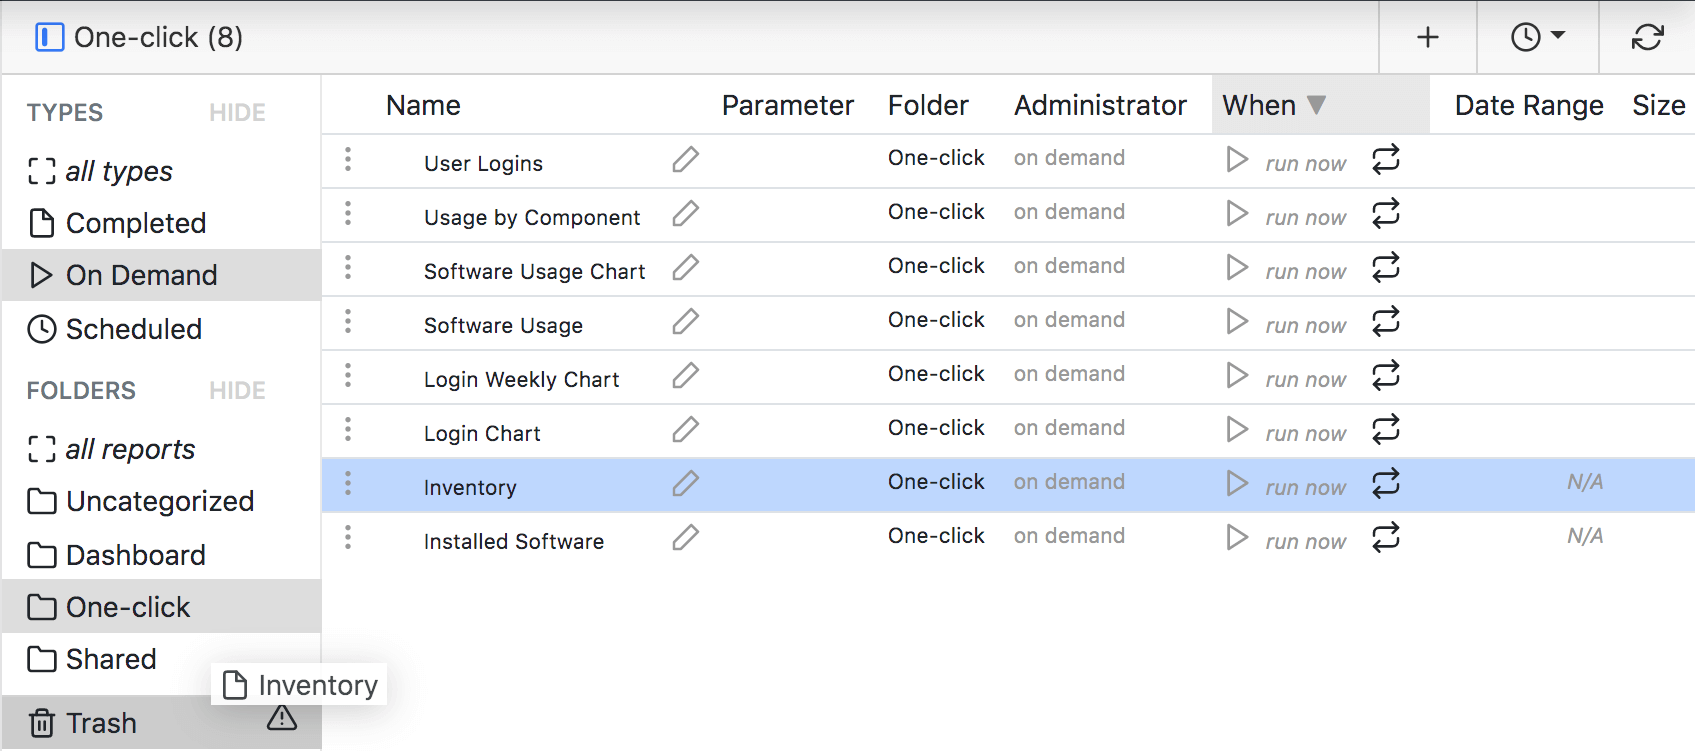
The UI here should now be familiar from the Computers, Printers, and Manage Software pages. You can filter the list of reports by choosing a Type and Folder of reports to display. You can move reports between folders by drag and drop. Note that if dragging to the trash, there is a warning symbol that appears. If you drag to that little symbol it will be deleted immediately, otherwise it will be in the trash for several days before the system removes it. You can select multiple items with shift and control clicks as per other screens.
Completed reports are actually the results of a previously run report. These are cached indefinitely, and occaisional clean up based on age of file can be prudent. This is also why the option to replace prior runs when setting up a scheduled or on demand report can be useful (see below).
On Demand are saved report templates that can be used to run a report without having to build it again. If saved to the One-click folder these are available to all admins on the main report page as a tile.
Scheduled reports are saved templates set up to execute on a schedule. These can be set with an email address to send notification when the report is ready.
Uncategorized is a special folder that is also the default location for saving report templates. It actually takes author into consideration, so you can only see the reports you have created. The root Administrator however can always see all reports.
In the screenshot, the Shared folder has been created manually. As previously noted, setting robust permissions for access is possible in KeyConfigure if needed.
You can also filter by time of creation using the Clock icon in the upper right.
More Functions
There are several icons and controls in the rows for reports. The left most icon (3 vertical dots) is the pull down menu. For saved templates there are options to Edit and Run Now. These actions can also be seen further across the row with the Pencil icon and the Arrow run now icon. The option to View Similar will show a list of all saved reports that match certain parameters.
For Completed reports, the drop down has options to View (arrow icon also seen in next column over) and Download the file. The Download will always be in our proprietary KSR format using this option (offline viewer available here). If however, you View the report, the pull down menu in the upper right will have options to download in a variety of other formats like PDF and Excel. More on this below in the Builder section.
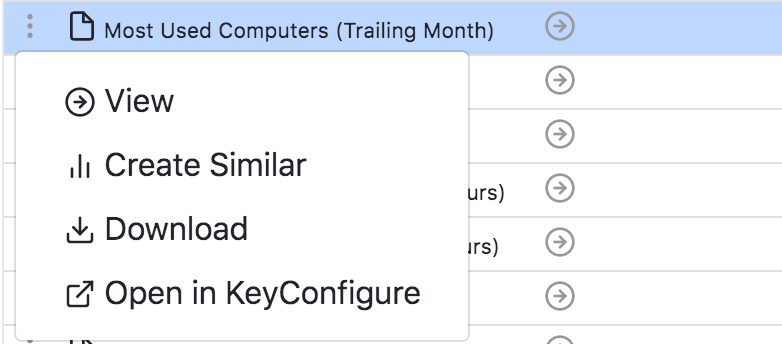
The option to Create Similar will take you to the report Builder having pre-selected many of the parameters used in the original. The option to Open in KeyConfigure works on Windows workstations with KeyConfigure installed to view the report in the admin application.
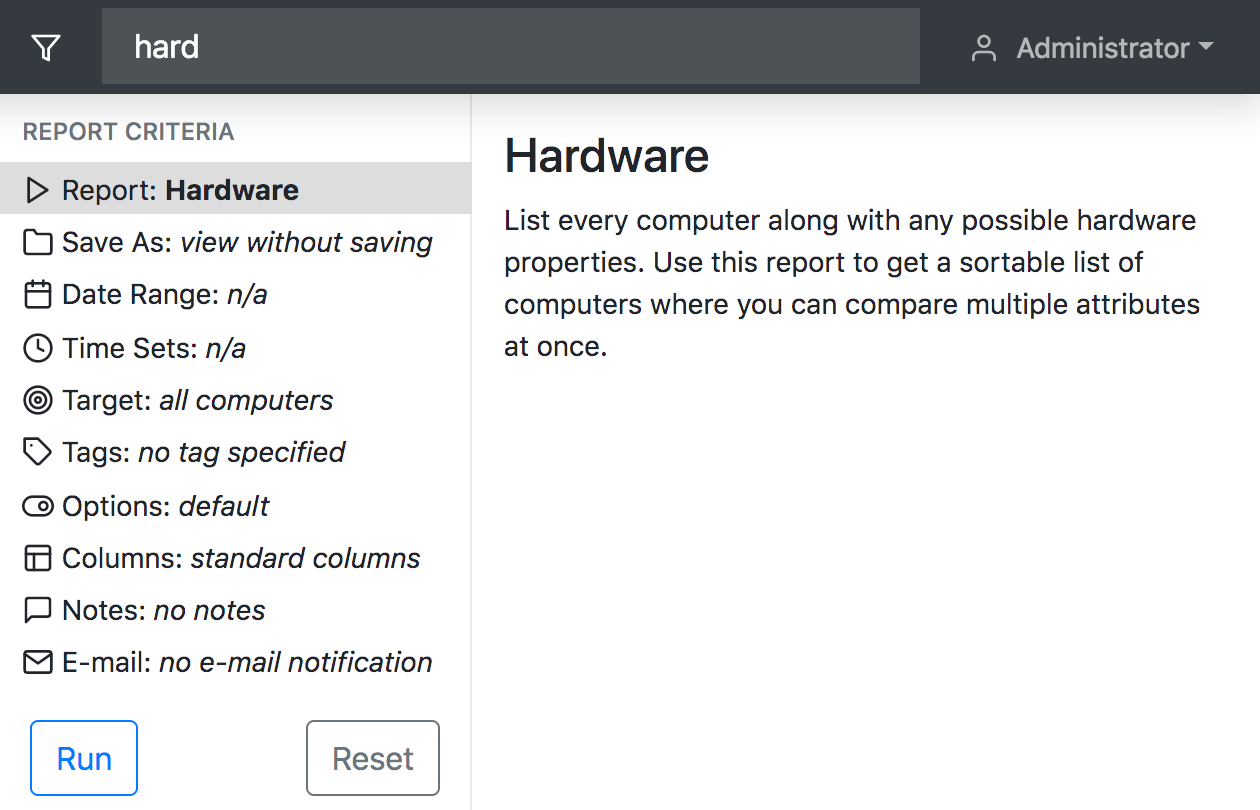
Report Builder
The Report Builder is the other option under the main page's Reports header. This is where you create reports then run them, or save them as Templates. The various features are fully documented so we will not repeat all of that information here. Keep in mind these pointers when getting started with the Builder:
Settings
While there are certain things that can only be managed in KeyConfigure, as of 8.0 almost all Settings are available in the Web UI. In many environments the needs for using KeyConfigure may be minimal and reserved for specialized tasks. We will not go into full detail of all these settings here (use the above link for more details), just touch on the high level and popular use items.
There are sub navigation items under Settings in the main navigation pane in addition to the Topics listed below in the sub navigation pane for Settings. The main sub items are more major features and include Account management, creating Actions and Forms, and managing Scripts and Extras. The other topics on the sub pane are more traditional settings.
Under General you can set an overall color theme and default name for the upper left. You can also set login conveniences for the Web site.
Under Maps you can set the primary Map Set if you make multiples, and a logo to be used when added to Floorplans. You can also change to use a custom tile set or Google Maps API rather than our default OpenStreeMap.
Under Printers you can configure a Papercut integration, or simply the default update interval for using IPP.
Generally speaking, PRS, Backups, and Logging are not going to be changed outside of troubleshooting.
Under Audits most defaults will not be changed. The top option however is your default audit cycle for computers. Many sites will desire to make this daily. Keep in mind if you have a large site (several thousand systems) you want to ensure your infrastructure (network, CPU and disk speed on server) are up to the task. It may be the equivalent of an email, but that's still several thousand "emails" to process each day.

The main impact of this setting is how often you'll get up to date information of the hardware and software on a Computer. If you're deploying software updates by SCCM for example and want to double verify they are working, having this set to 2 weeks is an issue. That is, you have to wait up to 2 weeks to know if the software has been updated by way of an Audit Report, but if this is daily you can check much sooner for reliable information.
The Mail settings quite simply let you set up to send daily status emails, alerts for critical issues, and the sending of scheduled Reports.
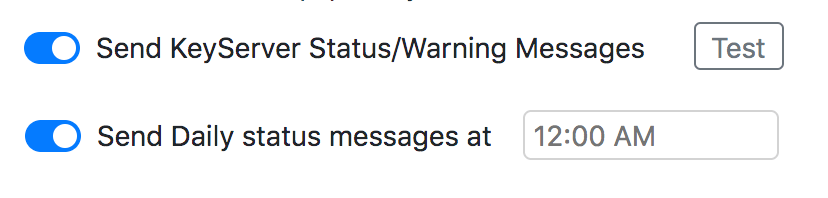
If you do not configure your mail server settings, then scheduled reports will fail to send as they have no place to go.
The Account Setup page is for setting up external authentication (e.g. Active Directory) for your user logins. Remember that by default there is Guest access on the web. If you disable Guest Browsing, then all users must authenticate. The easy mechanism is to route this (as default) to Community which is the same as Guest but for authenticated users. Other AD groups could then be mapped to higher level access as needed. Typically you will have a group for Administrators, which is the Manager Account level (full access). You can manage more granular account settings (Roles, Groups, etc) in the Accounts item under Settings in the main navigation sidebar. See Accounts for more details.
The Clients page is for handling of the KeyAccess connections to the server. In general these settings are not used for authentication because the OS of the workstations is doing that job. The main use here is for the automatic mapping of Divisions to OUs in your AD. Note that Reverse order of parts should be on if you want it to appear as in Active Directory Users and Computers. Remember normal AD syntax is backwards at command line, so by reversing order it's typical for the UI.
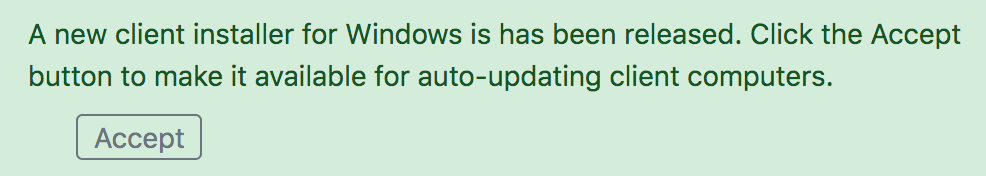
Updates is possibly the most interesting and popular item in this list. This is an easy way to keep all your workstations up to date with the latest version of KeyAccess. A green dot will appear next to Updates when there is a new version available. Simply click Apply for each platform, then click Save in the lower left. This is automatic and silent when clients check in so it will not disrupt users, and can take up to 48 hours to affect a given computer. Remember the client is forward and backward compatible, so you don't have to update the server to update clients.
Beware of making changes to Computer IDs. The order of these should be set upon initial configuration and deployment. Making changes later can cause issues with current workstations replicating records. Please work with our support team on any questions and needs changing these in production.
Columns allows you to create preset choices and constraints for various asset fields, as well as add Custom Columns for use with Computers, Devices, or Purchases. You can also create new Lifecycle Stages and Device Types.
Miscellaneous is as you might imagine a variety of other settings not of a certain category. The first 3 items are often of interest and most sites want these on and configured to a relevant idle time. That is, tracking Startup and Shutdown means the status on Maps is more accurate, and tracking Idle events means you can report on actual use vs idle time on computers. Set a threshold to consider a computer idle after not receiving any user input. At the bottom of this screen are the System Login Names. Simply input account names used for servicing machines (e.g. Admin, IT_service, etc) to have them be ignored in all Usage Reports.
Network contains options for the behavior of the Web Service. Generally the only setting needed is the first, which is the DNS name you want the service to respond to. This should be the ANAME or CNAME of the server as needed, and match the name of the SSL certificate you put in place.
Extras is used to enable add on modules developed by Sassafras. See below for more details.
Extras
Extras are additional applets that are enabled under Settings. Once an Extra has been turned on and you refresh the browser window, you'll see this navigation item. Clicking it has a widget style main screen where you'll see the applets you can run. Each applet will load a distinct screen with unique capabilities. These can be very robust like our Loaner Checkout extra and Pivot Tables.
Help
The Help page contains links to our various Tutorial Videos, this Documentation site, Blog Posts, and our Support contact information. We encourage use of these resources and invite any feedback you have on them.