7.8 -> 7.9 Important changes
This document describes the most important changes that a 7.8 admin should understand in order to take advantage of the new features in 7.9. New features are described with 7.8 as a point of reference, and features that are essentially unchanged will not be mentioned here. Upgrading from 7.8 should be smooth and as easy as running the latest 7.9 server installer, provided you have put the new server.lic file in place that supports 7.9.
If you are upgrading from an earlier version, read the Server Upgrade 7.x to 7.9 document, as it will give detailed steps including what to expect once you have upgraded.
Summary
Sassafras Software has long been a leader in Software Asset Management. Our 7.9 release continues to build on the asset management features that were expanded in 7.8. History tracking lets you see and report on various changes to Computers and Devices over their lifecycle. The addition of the Pivot Table Extra in the Web along with several other Report enhancements makes consuming and visualizing the robust data from our platform even more powerful. Several enhancements and additions to the Web UI, along with the introduction of Forms and Actions, bring more customization and utility to an easy to access and use tool.
History
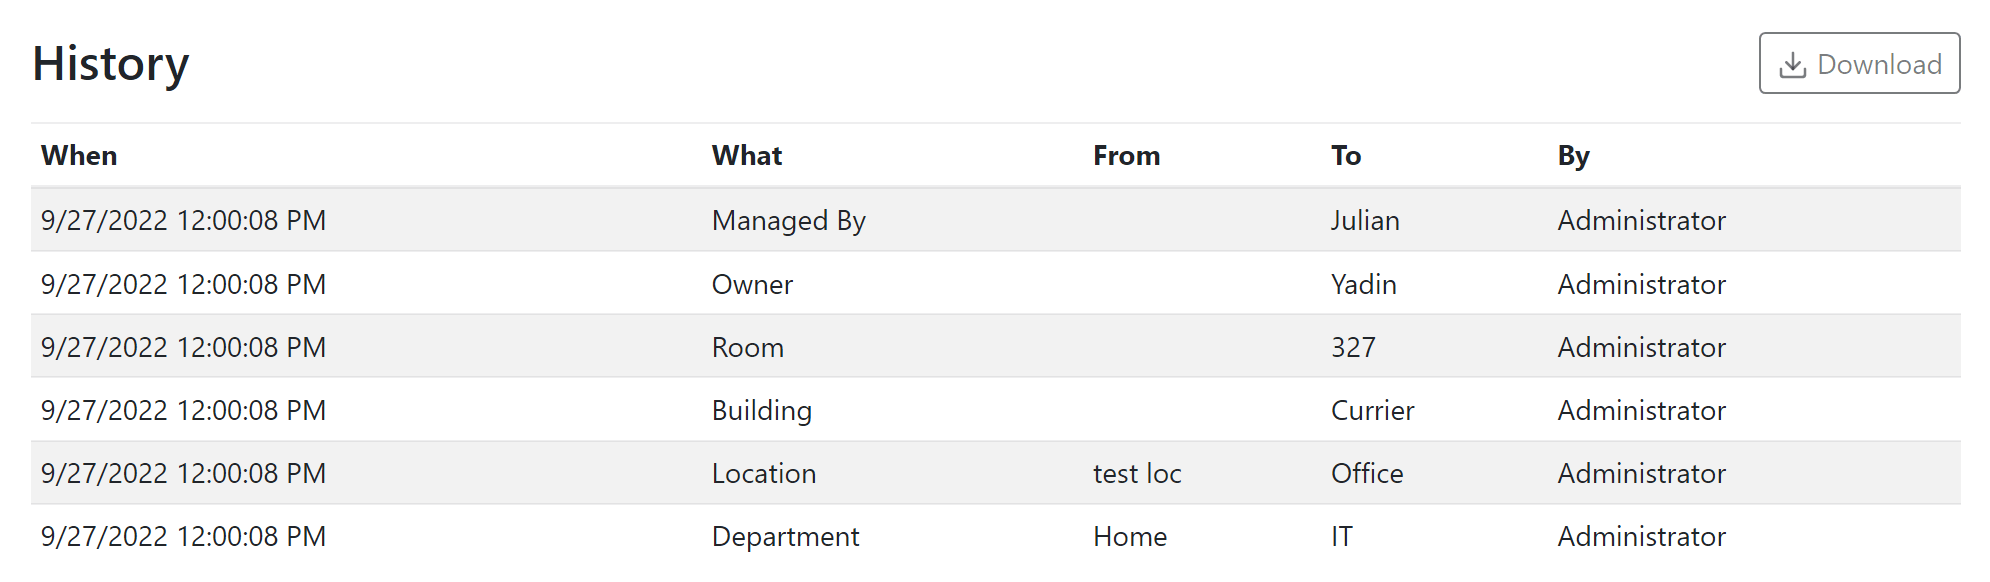
Computer and Device records will now keep a running history of changes to many of their attributes. From an Asset Management standpoint this means you can see the history of Owner, Department, etc as a resource moves through its lifecycle in the organization. From a Hardware standpoint you can see things like an increase in the amount of installed RAM. These histories are searchable and downloadable from the Web UI. The authenticated user making the change is also recorded so you have an audit trail of manual edits. Powerful Actions have also been added (see below) to further leverage this new data.
Several Reports have been added to complement this data. These include Lifecycle History, Loan History, and Owner History. While you can search all history events in a given asset, these reports allow for seeing all changes of a given type across the fleet or targeted subset.
Policies also have history now, so you can view changes to the license management options over time.
Pivot Tables
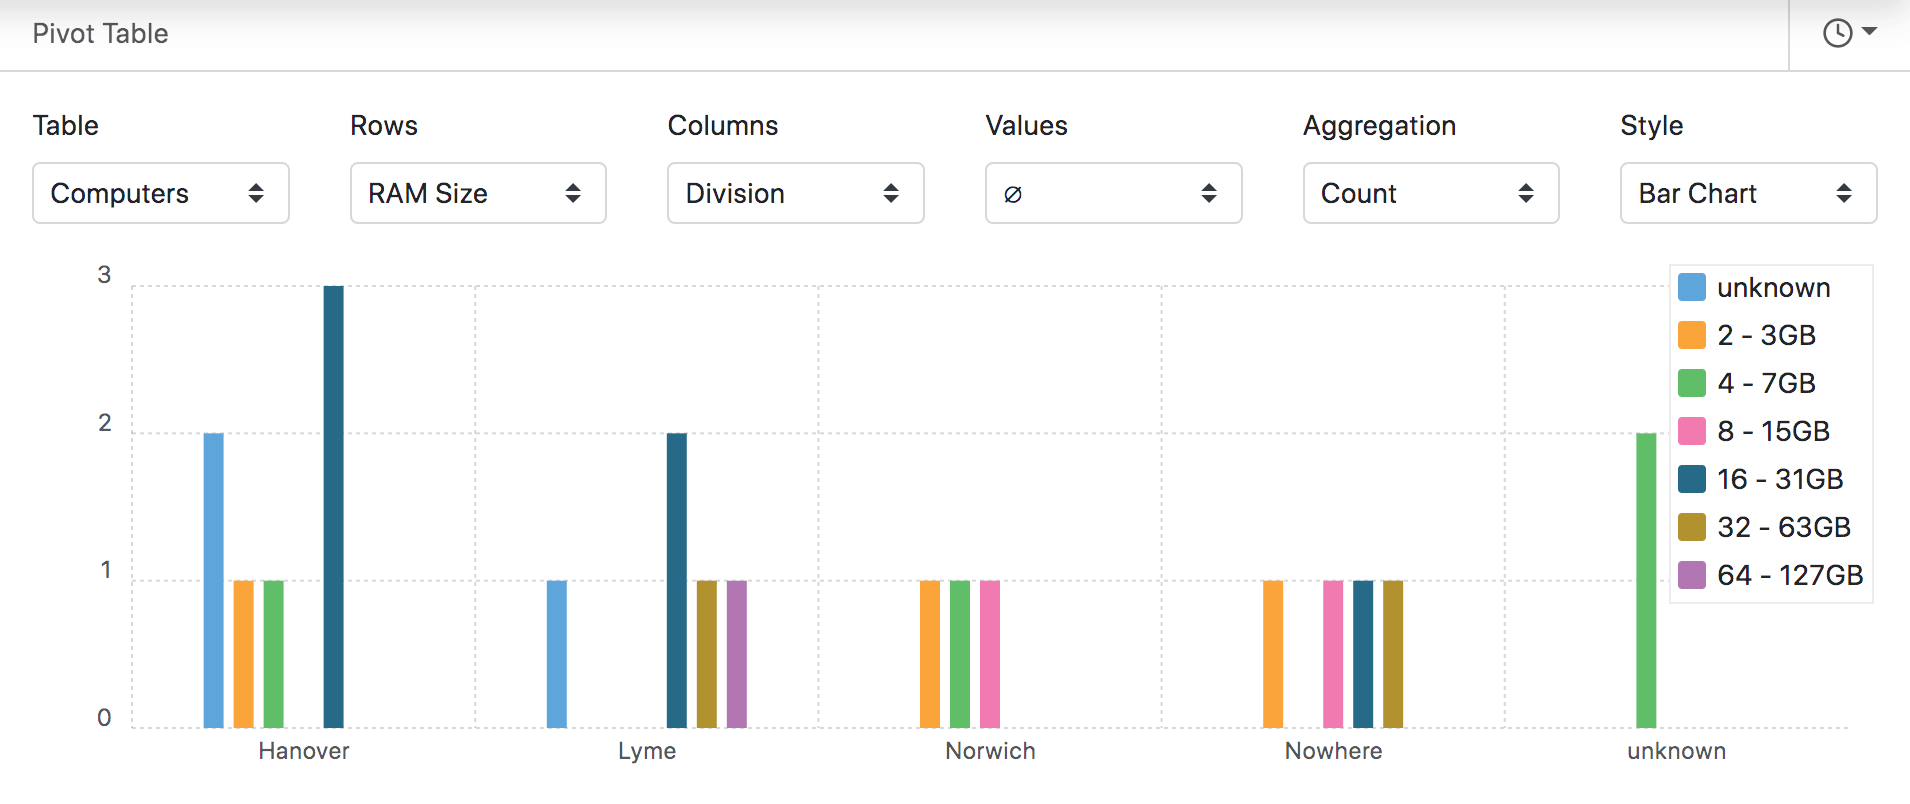
A robust new Extra has been added to the Web UI to allow for on the fly creation of Pivot Tables. This allows for data analysis by any arbitrary points and groupings so you can visualize results in a variety of charts. For example, you could show a bar chart of RAM allocation by Department or CPU Speed by Division. Those new to pivot tables can enjoy this new data visualization, and veterans no longer need to take report data to Excel to make them!
Actions
Many platforms have automations, and the time came for us to have them as well. With Actions in the Web UI you can create automations that send email or change asset attributes based on a variety of Triggers. For example, send an email to the Software manager when a new Program variant is discovered, or automatically set Computers to Dormant if their Lifecycle Stage is set to Retired. These emails can leverage a library of Macros to format the subject and message content based on the event information. There is even the ability to leverage Webhooks to call an API in another system! The new History events (see above) add even more triggers to the previously existing system events. Other examples could include:
- Send email when there is a change in RAM amount installed in a computer.
- Set the Managed By field (new in 7.9) when the Department is changed.
- Set the Department when the Division is changed, which can of course be due to automatic mapping from Active Directory.
- Send email when Accounts are modified (Role assignment).
- Send email when a Policy is created or deleted.
- Send email when a Policy Scope is changed.
- And much more!
Forms
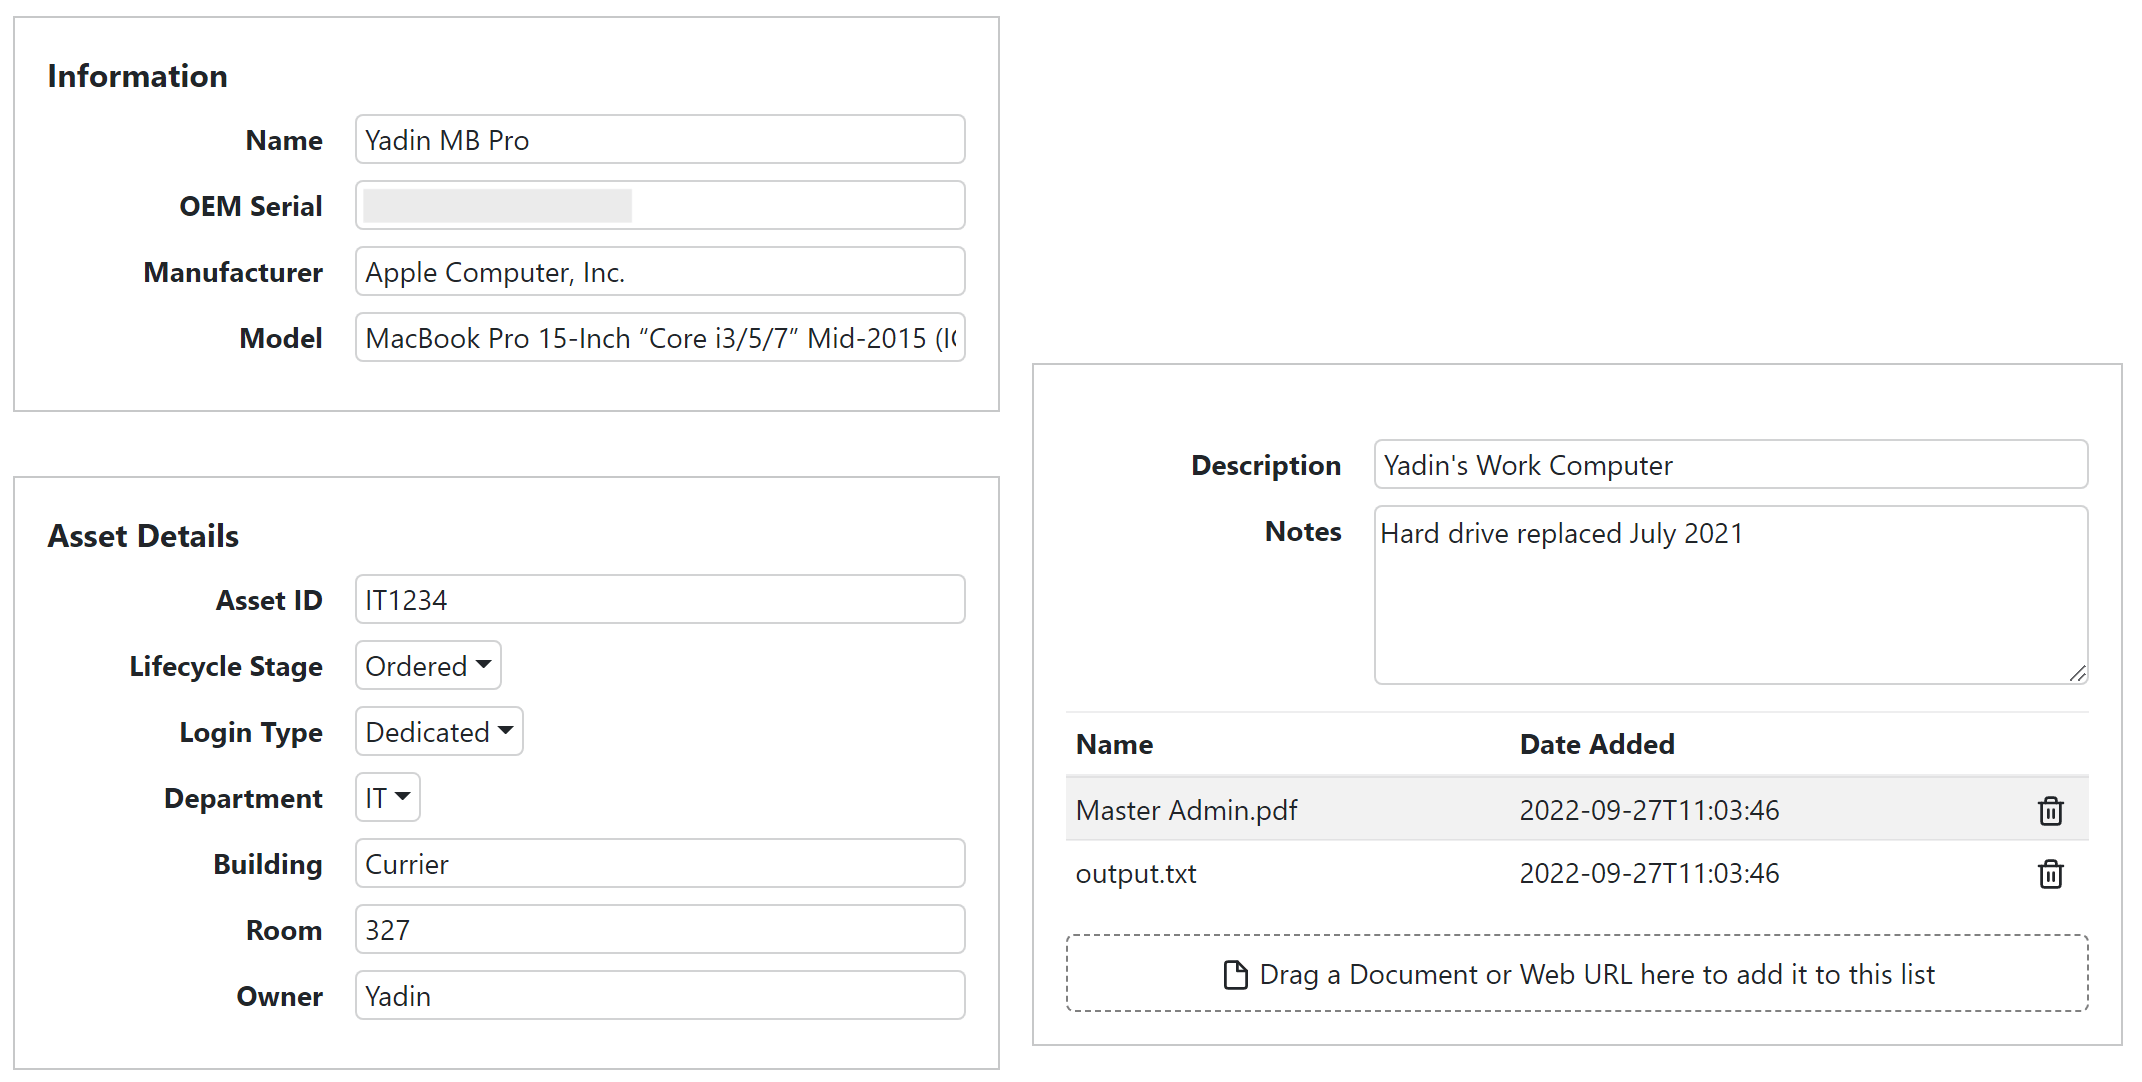
This new customization for the Web UI allows for creation of different layouts when viewing detail records. For example, you could choose to create a Computer Form that only shows certain fields for select input. You can then set for each privileged user what default form they use for Computers, Devices, and Purchases. In this way, you can present a simplified view of only the most relevant fields to a helper that is confirming physical inventory information. Or perhaps technicians are given a more basic list of Purchase details than the financial personnel.
Web UI Enhancements
Several enhancements have been brought to the Web UI:
- Filters are now available in the Web UI for Computers, Devices, and Purchases.
- In the Columns selection modal of the Computers and Devices pages, you can choose a Grouping field.
- Quick Edit allows you to select any number of items and modify any of their attributes at the same time. This reduces the need for certain scripts while expanding the capabilities of what you can modify.
- Access rights have been added for Extras so you can granularly control which users can access which features.
- Custom Fields can now be leveraged in Hardware Property Widgets.
Reporting Enhancements
Aggregation was formerly a simple checkbox in the Target pane of the report builder. It is now a drop down menu of the various data fields of the object type of the report. This means for example you could aggregate a Computer Usage report on the Department field, or Manufacturer, or whatever else may be of interest. Keep in mind not all fields would produce meaningful aggregation, but where applicable this allows you to group data in ways never before possible.
Custom Columns are now available in hardware reports (Computers and Devices). Yes, you can say "finally" 😉
When viewing a completed report in the Web UI, you can choose the time and duration formats used for the display. Note these are not used in saved files like PDF, but they allow for increased detail in some cases. Changing to H:MM:SS for example if you need an exact figure vs Days for a more high level view.
Other
Here are a few additional items of interest. As always we have made many other small improvements which may not be listed here at all. As new features may be added in point releases over time, those of note will get added below as well.
- Normalization of Manufacturer names
- Settings for Alerts in the Web UI
- Mangement of Accounts and Roles in the Web UI
- New Asset fields for Computers and Devices: Managed By and Replacement Cost
- New Web Description field for Products allows for custom description text on the Software page of the Web UI
- Search of Report results in web UI (7.9.0.2)
- Gather list of accounts with local admin rights on each workstation (7.9.0.3)
See our Release Blog for more details on each version.