Dashboard
The Web UI has a dashboard view that can be configured independently for each Administrator (any authenticated user of the system), so each person can have a unique view suited to their role in the platform. Any administrator with the proper permissions can also save dashboards for other users, including the default for all new users without a personal dashboard, and the public Guest or Community view. When logging in to the Web UI, your default view will be of your dashboard, or the Default dashboard if you have not yet made a custom dashboard. If the Guest dashboard is blank, the default view is Maps for guest viewers (if Guest is enabled). A dashboard can be customized to include whatever widgets you want using the + in the upper right and dragging them around and resizing as desired. Widgets provide quick graphical summaries of data. For documentation and screenshots of all of the available widgets, see the Widgets list.
In any new Dashboard there is a single tab named "Main" - additional tabs can be added by clicking the smaller plus just to the right of the existing tabs. Additional tabs can be renamed by double clicking on them, but not the Main tab. You can choose to have all your widgets on one big page, or arrange them on tabs to your liking.
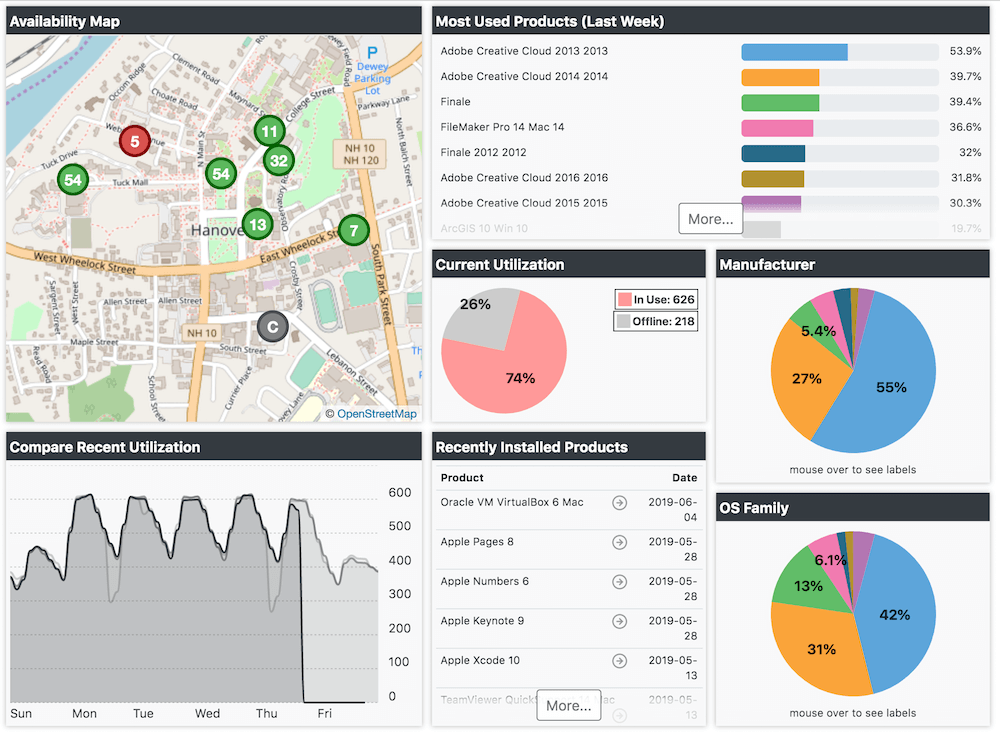
The picture above shows the Default dashboard as it might look on a production system. When you first deploy ITAM, these widgets will not offer much to look at as there will be no divisions, products, policies, or usage data. The various sample dashboards should give you some ideas of the sort of things you can do, without having to test each and every widget one by one. Ultimately you will probably want to do some customization - our samples may not be precisely what you need.
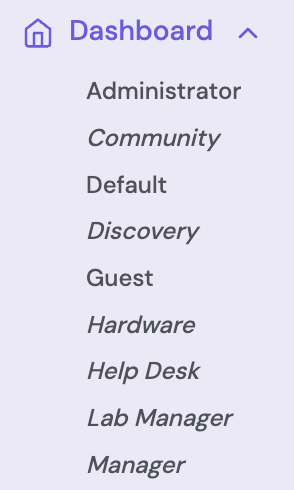
The ⁞ ▾ pull down menu on the far right of the Ribbon has options to save the current Dashboard under a different name for later use, or Erase dashboards you no longer need. All dashboards can be viewed by clicking the disclosure triangle next to the Dashboard menu item in the Side Bar on the left. When you select a dashboard to view, the name of that dashboard will show at the top of the sub menu with an x next to it to signify you're not currently looking at your personal dashboard. Be aware there is no Save or Revert when modifying a dashboard, it is live. If you are an Administrator looking at another dashboard, proceed with caution.
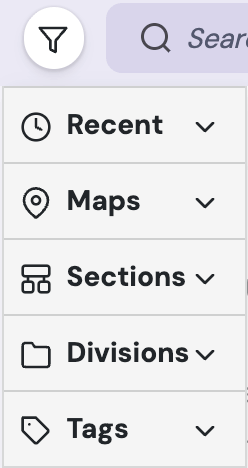
Using the Scope (funnel icon) in the header Bar, you can change the scope of an entire Dashboard to only apply to the computers in a given Section, Division, Map or Tag on the fly. This allows for very fast comparison of data between sub sets of your assets without having to create separate dashboards or tabs. Note that certain widgets respond differently to different scopes. For example, the Availability widget in the Default dashboard can actually change to a given map if you use a scope under the Maps section, but will continue to show the list (or geographic map) of all maps if you choose a Division as the scope.
Widgets
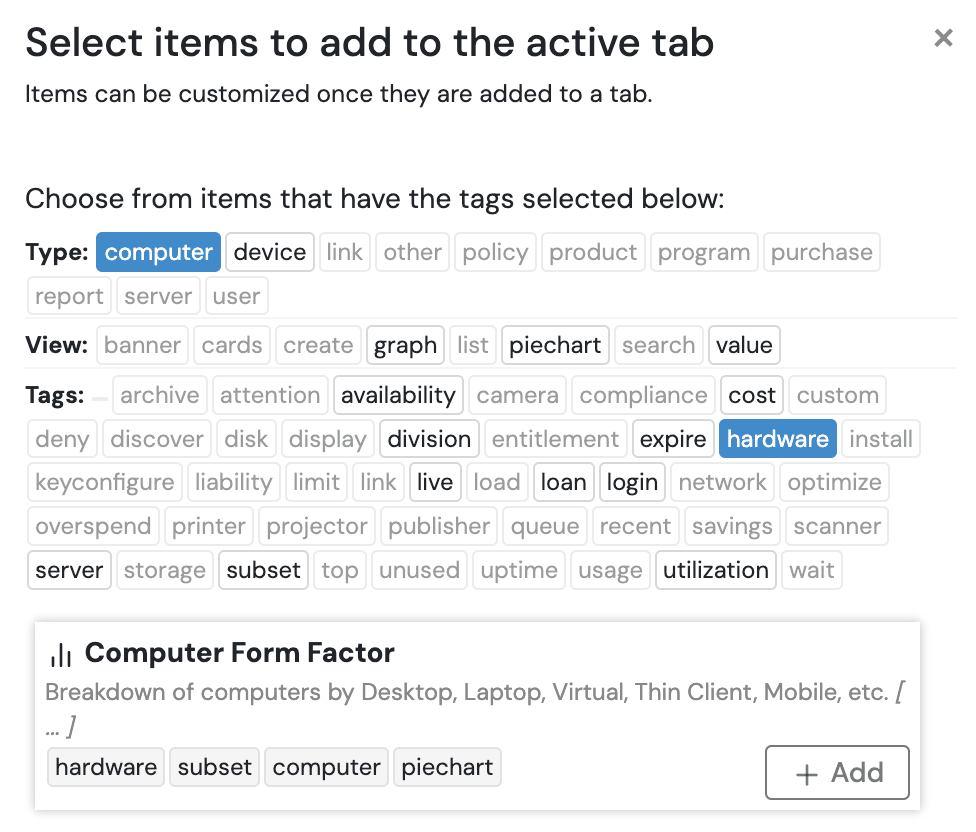
To add a new Widget to your dashboard, click the + in the upper right. Note this will add the widget to the active tab of the current dashboard you are viewing. Initially all you will see is a list of Topics. You must click at least one topic to see a list of relevant items. If you select multiple topics of different types, like Computer and Hardware as shown below, you get only those widgets that match both keywords. Each widget has a short description, and you can scroll through the list if it's a long set of matches. If any copies of a widget are already on the active dashboard, a small number will appear in the upper right of the widget indicating this and how many. When you find the widget you want, click Add.
Each Widget when you mouse over it will show icons in the title bar. The gear the the most important for configuring the widget, and many widgets will be blank until you configure them. The Camera icon (if supported) allows you to save an image of the widget contents. The refresh arrows reload the widget data. And of course the x removes that widget from the dashboard.
Configuring
Configuring a widget will show a variety of applicable options which vary greatly between widgets. Some will have very few options, others will have many. Here we show the Computer Property Widget which has some of the most robust options of any widget.
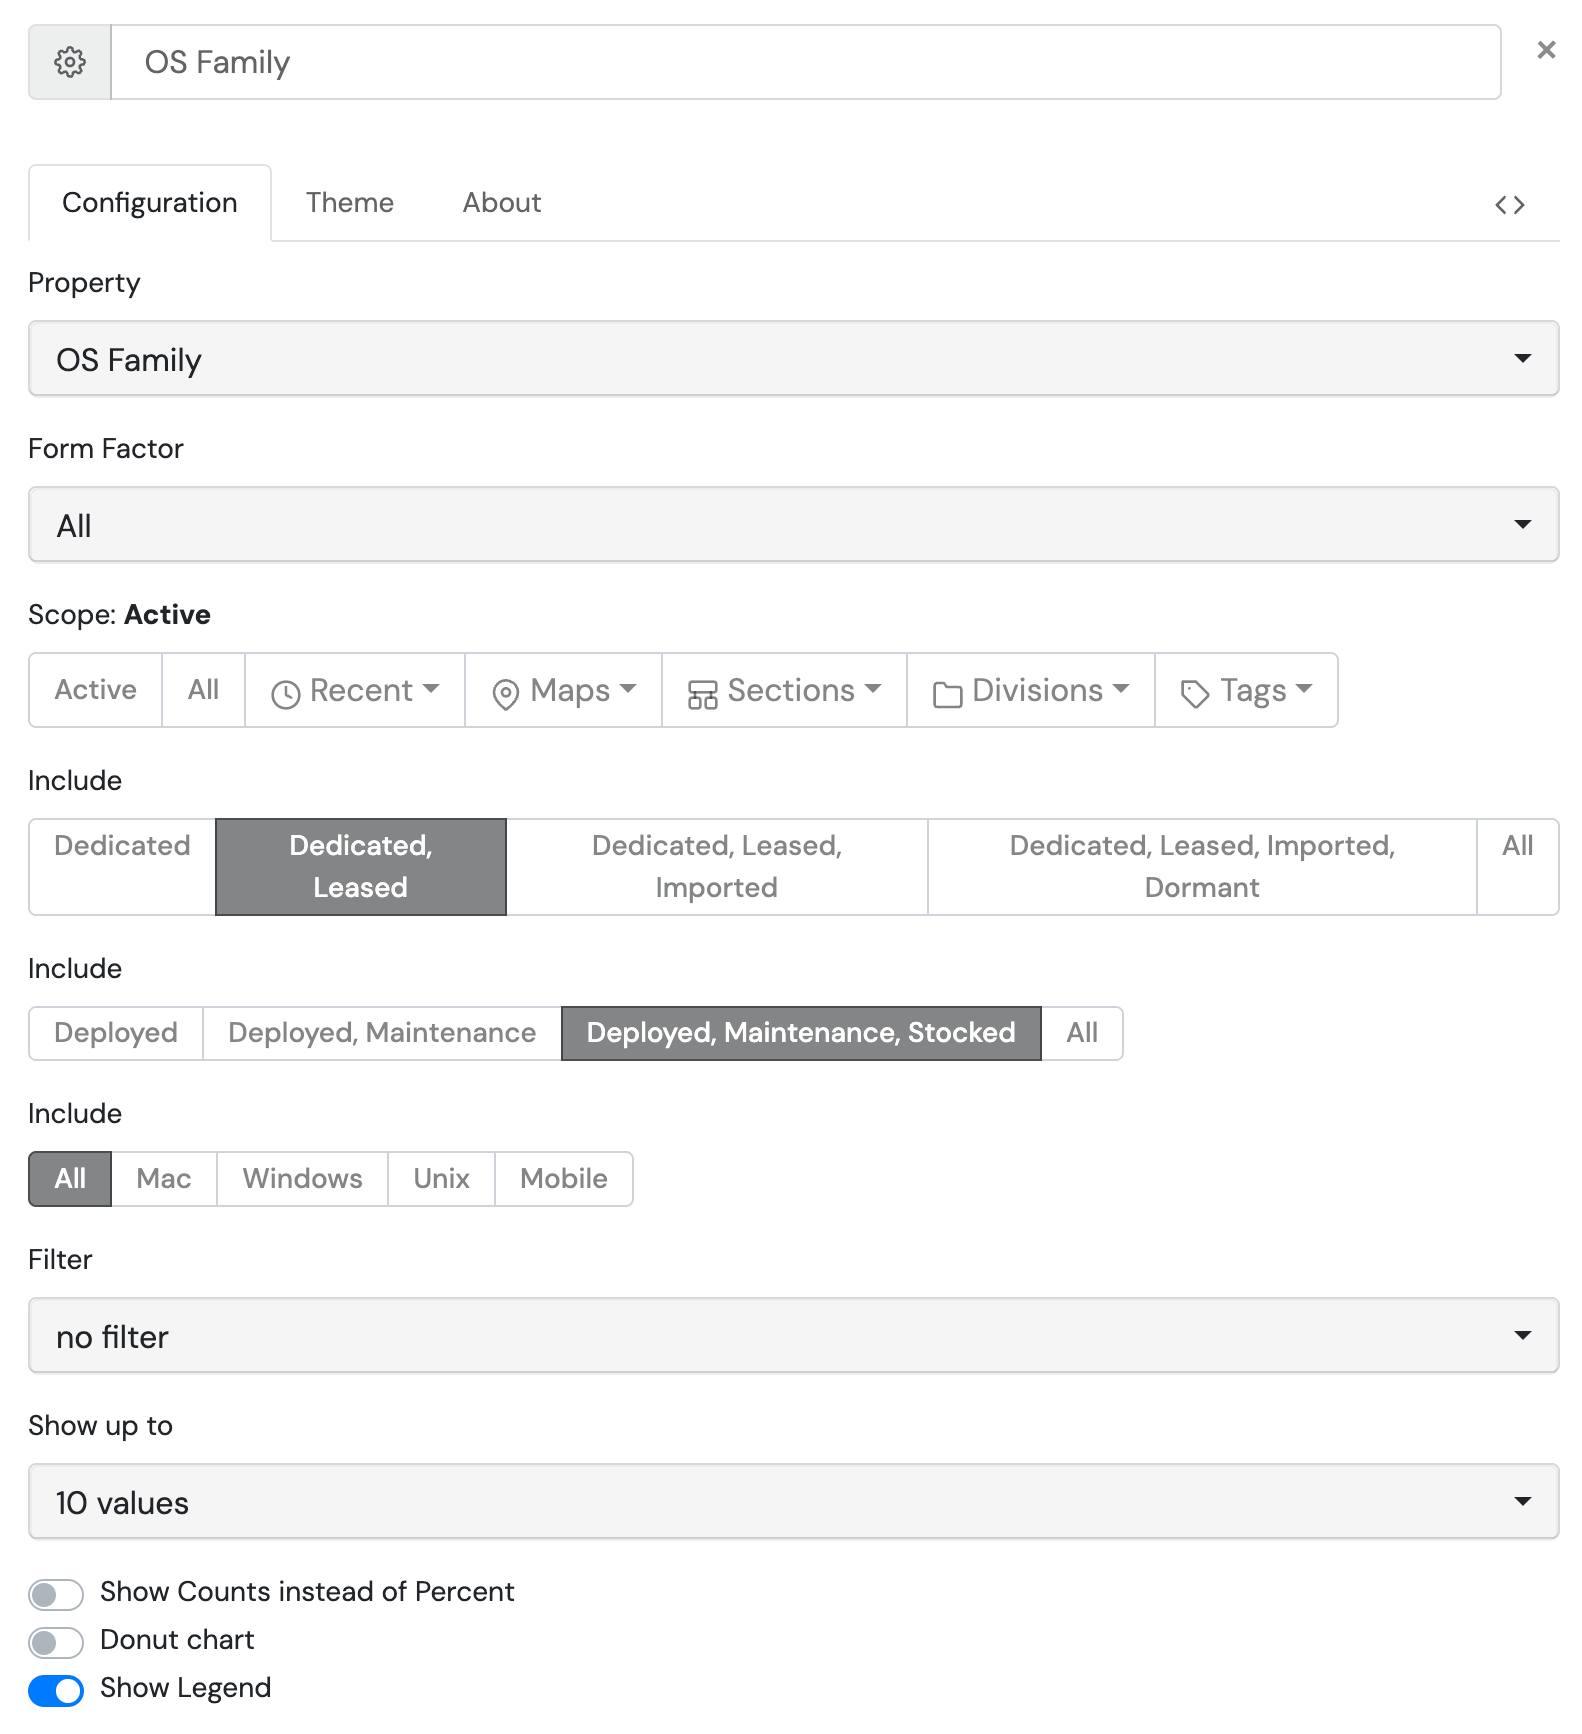
Common items you will find include:
- Name - The box at the top of the window. You can customize the name to better reflect your exact settings in the widget.
- Attributes - In this example, the Property you want to display, and the Form Factor of computers you want to limit to showing.
- Scope - When active, it obeys the main Scope of the web UI. A widget can be locked to a specific scope instead.
- Include - Multiple items for what things to include the like the computer Login type, Lifecycle stage, and Platform.
- Filter - Add an advanced filter to the widget display.
- Options - How many values to show, how to show the numeric information, and if you want a legend shown.
With all these options, you could easily have multiple nearly identical widgets next to each other on the dashboard. You might want to show Windows computers on one, Mac on another. Or deployed systems on one and in stock systems on another. Use your imagination to figure out what would be most useful to see at a glance.
Interaction
Many widgets are interactive. As you mouse over the slices of a pie chard or bars on a graph, more detail of that segment of the chart are shown. If you click on one of these, you will be taken to a report page that has the list of items that contribute to that slice. For example, the list of computers that have that old OS version, or the detail record for the user currently using a seat of that software.
Availability Widget
Of special note, this widget will be blank if you have no Maps created. It is designed to display a graphic view of lab computers showing which are available for login vs those which are not. It is included on the Default dashboard, but can be confusing why it refuses to show anything if you have not yet worked with the Maps portion of the platform.
Special Dashboards
Guest
By default, Guest access is allowed but will only show the Guest Dashboard (if created), Maps that have been made public, and the Software list. Guests are not allowed to access Computers, Printers, Reports, or Settings, nor are they allowed to customize the Dashboard in any way.
To change the Guest Dashboard, an Administrator with "Change Other Dashboards" privilege in the "KeyReporter Privileges" section of Role Details must log in to the Web UI. The built in Admin account can do this, or any role assigned Full rights or this specific privilege. Expand the Dashboards menu in the upper left of the Navigation pane and click on the Guest dashboard. Any changes you make are saved instantly. When you are finished, you can close the Guest dashboard by clicking the x next to it at the top of the Dashboards list in the Navigation, or navigate back to your dashboard by selecting it in the list. Log out (or better, use a private browsing window) to verify your changes appear as desired under the Guest view.
To disable Guest view access, navigate to Settings - Account Setup and toggle the option. Note the actual functionality of this account is mostly controlled by the software, so even if you add the Administrator role to this account it will not actually have those rights. Note you can have all users authenticate but still have guest access using the Community account using the settings in Account Setup. If you have users that you wish to grant specific abilities or access to, using Active Directory, Azure, or other integration and assigning roles to external groups is an excellent option at scale.
Community
If you turn off Guest access for security but still want anyone at your organization to be able to have Guest access, that is the purpose of Community. You can leverage this in the Account Setup by routing all other authenticated users to the Community account. This means everyone who logs in but is not in a privileged group will see the Community dashboard. In a more subtle environment this means Guest could be enabled and show no dashboard, but once you log in you see the Community dashboard.
Default
As mentioned above, this is the dashboard all privileged users see when not routed to a shared account experience like Community or Staff. As soon as an account with rights to modify their dashboard makes a change, a clone of the default is made under their account name with the change they just made. So while an admin can control the starting experience for all new users and those who can't change their dashboard, modifications to individual dashboards would be needed later if that was a global goal. Keep this in mind when assigning rights in the platform.
Examples
Several example dashboards are included with the platform. If an admin changes one of these, it is changed, and anyone looking at it sees the custom version compared to our out of box example. These include but are not limited to Hardware, Help Desk, Lab Manager, Purchasing, and others. They are intended to give you ideas of what a dashboard can show, and possibly how you can use a "shared" dashboard. Note that either you can see other dashboards (not your own) or not. There are not permissions per dashboard.
Built in Accounts
There are a variety of built in accounts that are also intended mostly for example purposes. Most notable perhaps is the Manager account. It is not advised to actually use this as it would mean all admins share one account so there is no individual change log information and they all share the Manager dashboard. More details about account configuration and authentication actions are found in the Account Setup and Accounts sections of the documentation.
Cleanup
If you see a Dashboard for a person who no longer has access to the platform, you should check the Accounts. When you delete an Account, it should delete the linked Dashboard.