For years, Boise State University has relied on usage statistics gathered by KeyServer not only to optimize software expenditures but also to determine how public computers are used and how best to configure labs. In 2013, they were honored by University Business Magazine as a “Model of Efficiency”.
The result of their work was indeed impressive:
… to staff the labs and open the walk-in support centers would have cost an additional $140,000 in student labor, plus $25,000 for added hardware to keep pace with demand, for a total of $165,000. Instead, the university simply made better use of what it already had.
In order to achieve this result, Boise State relied on the detailed login and software usage events recorded by KeyServer in order to assess computer and lab usage – as well as similar data from other systems that monitor Printers and wireless access points.
The key was in moving computers closer to students and classrooms. Using Sassafras KeyServer, Fitzgerald and his team tracked which lab computers were getting the most usage in terms of number of students logging in and amount of time spent. Based on that data, computers in seven manned labs were consolidated into three and employees from the four labs that were shuttered were reassigned to new walk-in centers. The remaining computer units were dispersed into lobbies and common areas. The result: computer usage has gone up 20 percent.
The full article can be found here: https://news.boisestate.edu/update/2014/01/30/boise-state-honored-model-efficiency/
Since 2013 when that article was published, KeyServer has had four major releases, and functionality for lab and hardware management has continued to grow and improve. Most notably, Lab Availability Maps were added in version 7.2 Not only does this allow students to have a live view of available computers (making computer usage more efficient), it also gives Administrators a “Heat Map” to analyze usage patterns.

Additional reports were also added to analyze data in new ways. For example, the Login Peaks report specifically lets you look at usage of labs hour-by-hour and day-by-day.
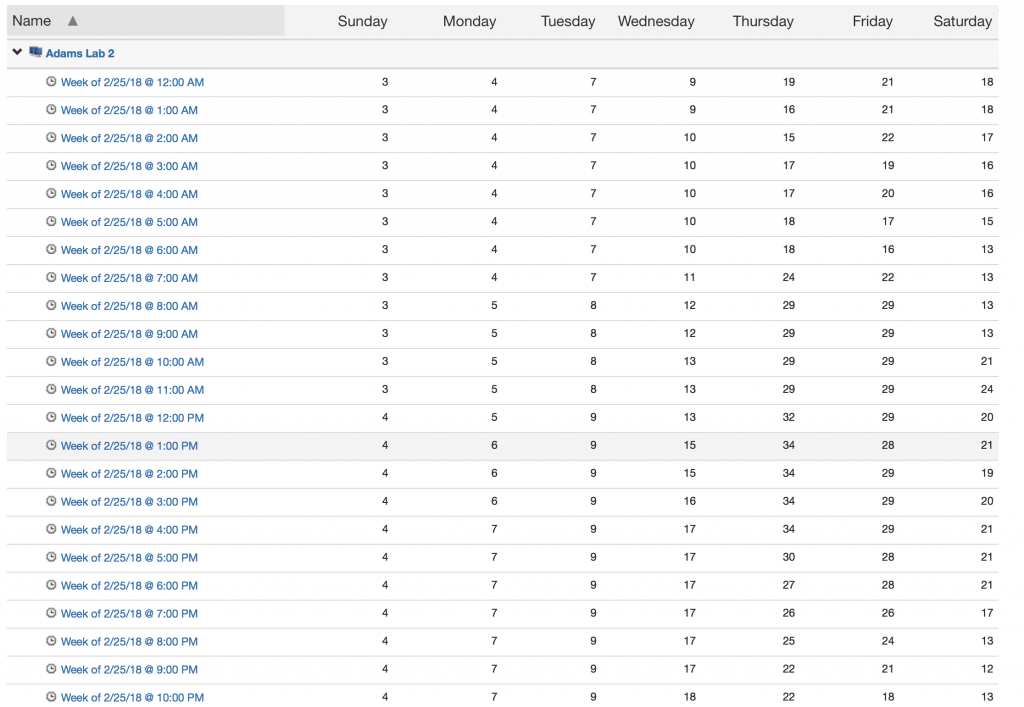
It is immediately apparent in the picture above that this lab is most busy on Thursdays around 1PM. In this example there are no hours where usage drops to zero but if there were it would be easy to identify. This is exactly the sort of data that was used at Boise State University, and at other sites to rationalize computer lab deployments (e.g. see also the Evergreen State College case study).
We reached out recently to Mark Fitzgerald at Boise State University, who added:
We are still using the data to figure out which computers are being used and to what extent. We make changes every year based on it.
With another major release of KeyServer due this summer, you can expect to see some really exciting further improvements to maps which will make setup even easier and more flexible than ever.
If you would like to share with us how you’ve used KeyServer to save money, we’d love to hear it. Call or email us!
Subscribe